
FIGURE 3. Effect of tolterodine on maximal CCh evoked increases in [Ca2+]i.
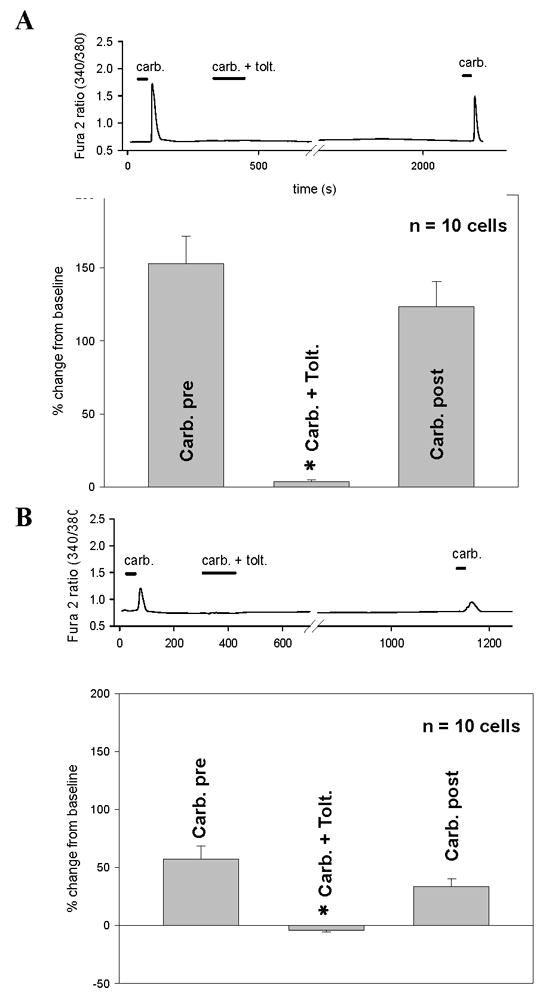
A: Tracing depicts CCh (carb, 1 mM) evoked increase in [Ca2+]i in IC BUC which then was reversibly blocked by tolterodine (carb. + tolt). This effect was reversible with a subsequent exposure to 1 mM CCh represented by the last peak in the tracing. Bars in tracing represent duration of exposure. The graph depicts pooled data from n=10 cells showing that tolterodine completely abrogated CCh evoked responses (p<0.01) and that this effect was completely reversible (Carb. post).
B: Same as panel A, except performed in NB BUC. Tolterodine had similar effects on NB BUC and these effects were reversible.