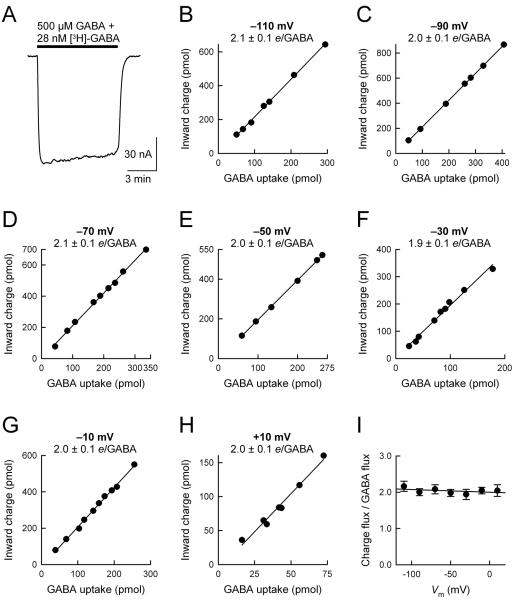
Fig. 2. The ratio of GAT1-mediated charge flux to GABA flux is not altered by changes in the membrane potential.
(A) GABA uptake experiments were performed under voltage clamp at membrane potentials ranging from −110 mV to +10 mV. (B–H) Net inward charge flux is plotted as a function of GABA uptake in individual GAT1-expressing cells. Cells expressing GAT1 were held at the indicated membrane potential and exposed to 500 μM GABA and 28 nM [3H]-GABA for 5–10 minutes. After washout of GABA and isotope, the cells were solubilized in 10% SDS and cellular GABA content was determined by using a liquid scintillation counter. In the same cell, the net inward charge flux was obtained from time integral of the current trace. To determine GAT1-mediated GABA uptake, endogenous uptake of GABA was determined in control cells from the same batch and subtracted from total GABA uptake in GAT1-expressing cells. Endogenous GABA uptake was not voltage dependent but varied in cells obtained from different donor frogs (0.28–0.66 pmol/min/oocyte). In GAT1-expressing cells, uptake rates ranged from 5 to 401 pmol/min/oocyte. In all experiments, endogenous GABA uptake was ≤ 5% of total GABA uptake. The ratio of charge flux to GABA flux (i.e., net positive charges per GABA, e/GABA) was 2.1 ± 0.1 at −110 mV (n = 7), 2.0 ± 0.1 at −90 mV (n = 7), 2.1 ± 0.1 at −70 mV (n = 9), 2.0 ± 0.1 at −50 mV (n = 6), 1.9 ± 0.1 at −30 mV (n = 9), 2.0 ± 0.1 at −10 mV (n = 10), and 2.0 ± 0.1 at +10 mV (n = 7). In each panel, the smooth line is a linear regression through the data points. (I) The ratio of charge flux to GABA flux is plotted as a function of the imposed membrane potential. At all membrane potentials examined (−110 mV to +10 mV), the ratio of charge flux to GABA flux was 2 positive charges/GABA. The smooth line is a linear regression through the data points, and its slope is not significantly different from zero (p = 0.34).

