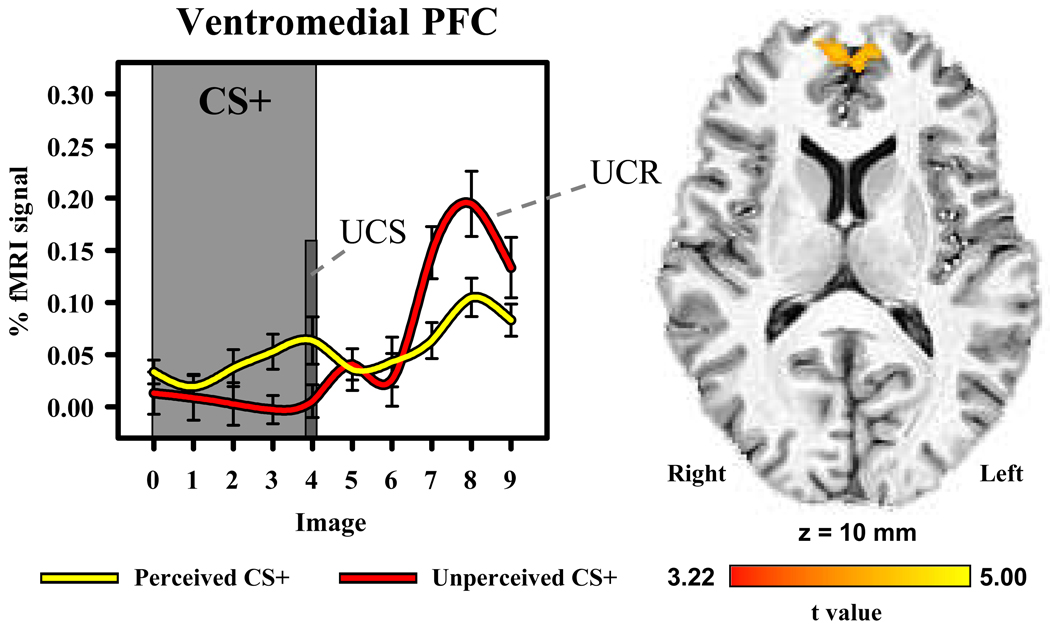
Figure 3.
UCR diminution within the ventromedial PFC. The unconditioned fMRI signal response was larger when the UCS followed the unperceived compared to perceived CS+. The graph depicts the fMRI time course (% signal change from baseline) for perceived and unperceived CS+ trials. Error bars represent standard error of the mean.

