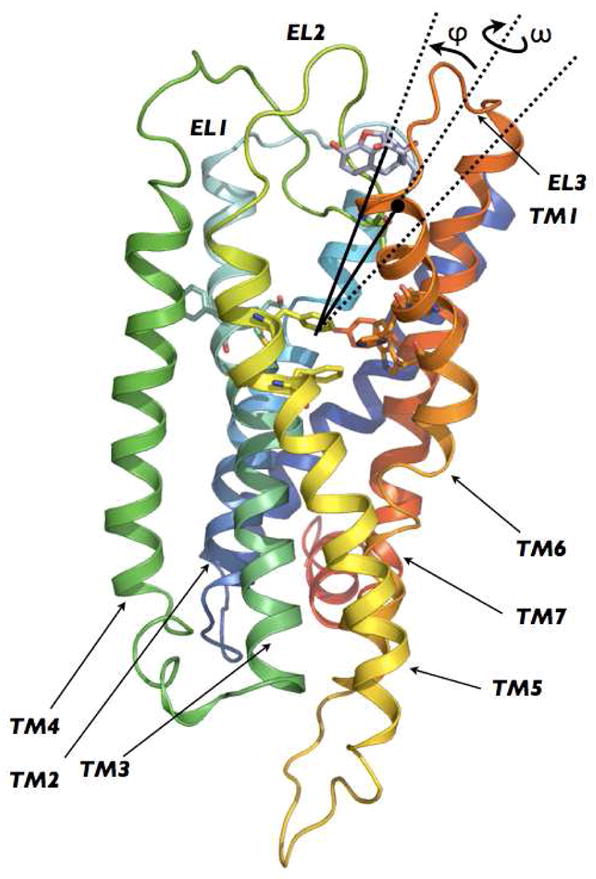
Figure 1.

Side view of the initial 3D model of human DOR built according to the procedure described in Methods. TM1, TM2, TM3, TM4, TM5, TM6, and TM7 are colored in purple, blue, light blue, light green, green, yellow, orange and red, respectively. The 5-degree conical restraint that was applied to circumscribe NLX sampling is indicated by the black lines defining the angle between the COM of the binding pocket, the COM of the ligand, and the COM of residue L3007.35 (black dot in the figure).
