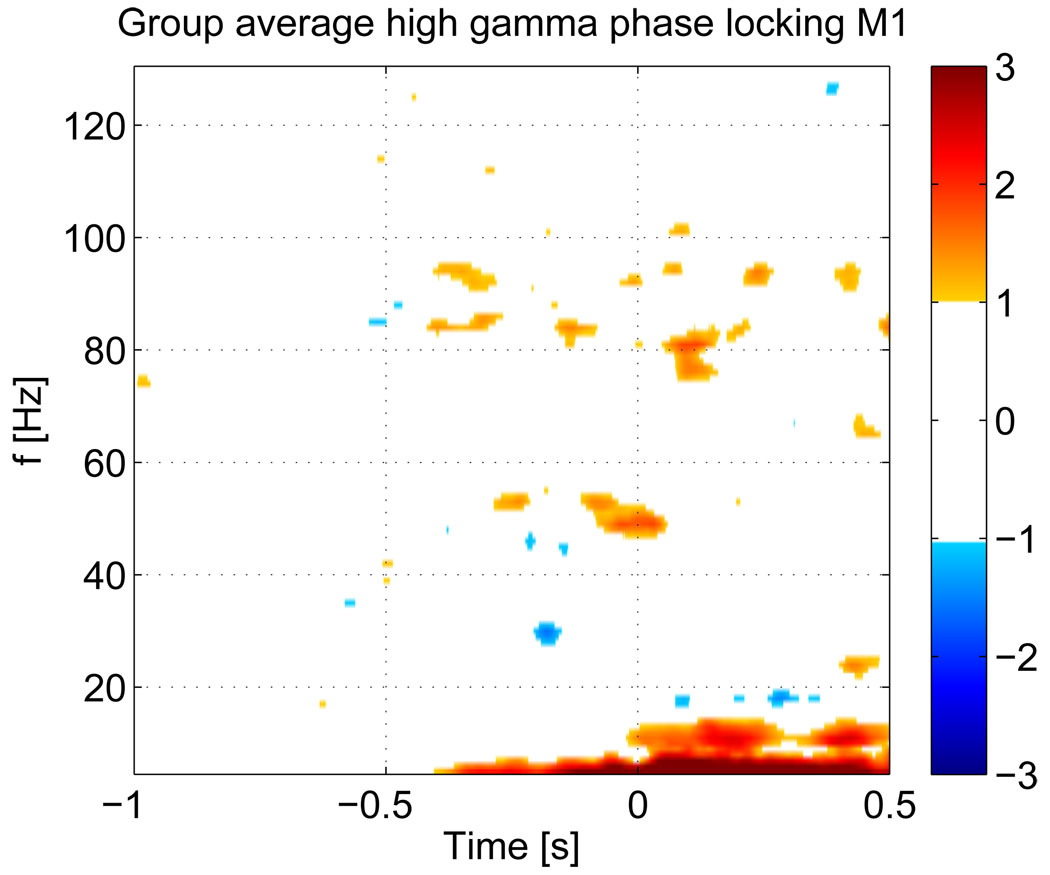
Figure 10.
Group average of the mean PLV for all subjects. The threshold for the Z-score map is set at ‖Z‖ ≥ 1. Note that ,since we average over ten subjects, only values exceeding 3.16 std are shown, corresponding to an uncorrected p ≤ 10−5 for each voxel. In contrast to individual results, the group average shows that phase-locking is limited to the HG range.

