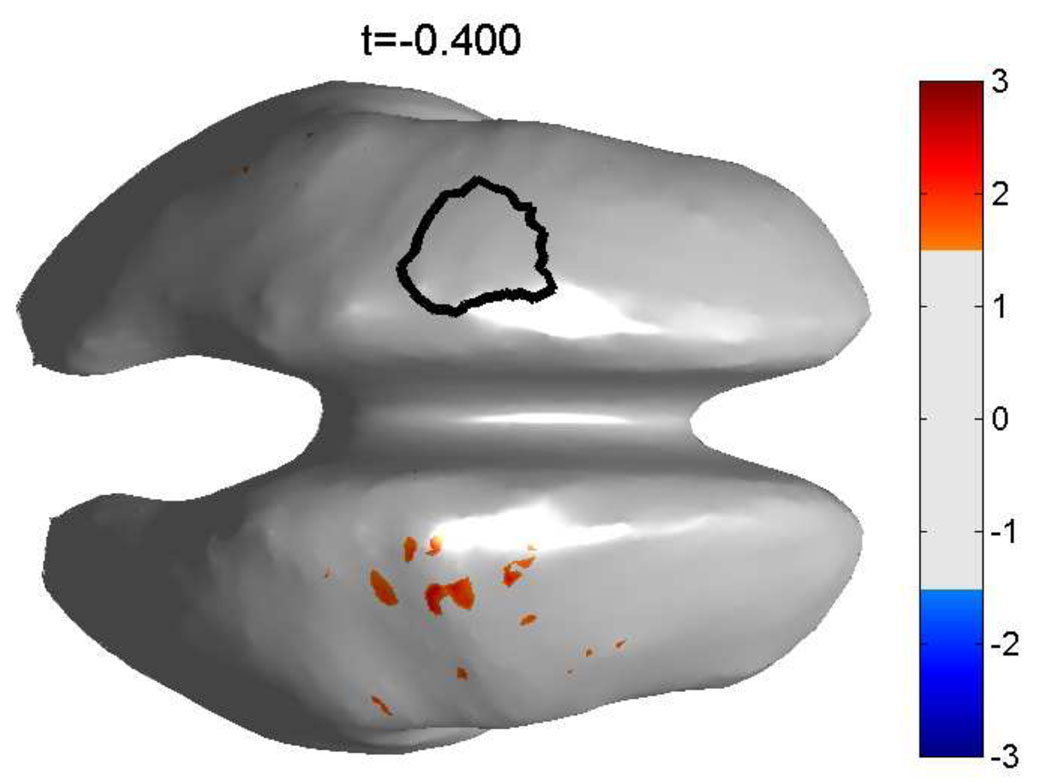
Figure 11.
Map of the group average over all subjects for the PLV between all voxels in the left hemispheric ROI and the right hemispheric ROI. The threshold is set at ‖Z‖ ≥ 1.5, corresponding to 4.5 std or an uncorrected p-value of p ≤ 2 * 10−10 for each voxel. The left hemispheric ROI, outlined in black, was used as the seed region. The map shows that synchronization from the seed area to the right motor area is the only significant synchronization at this latency (400 ms before movement onset).

