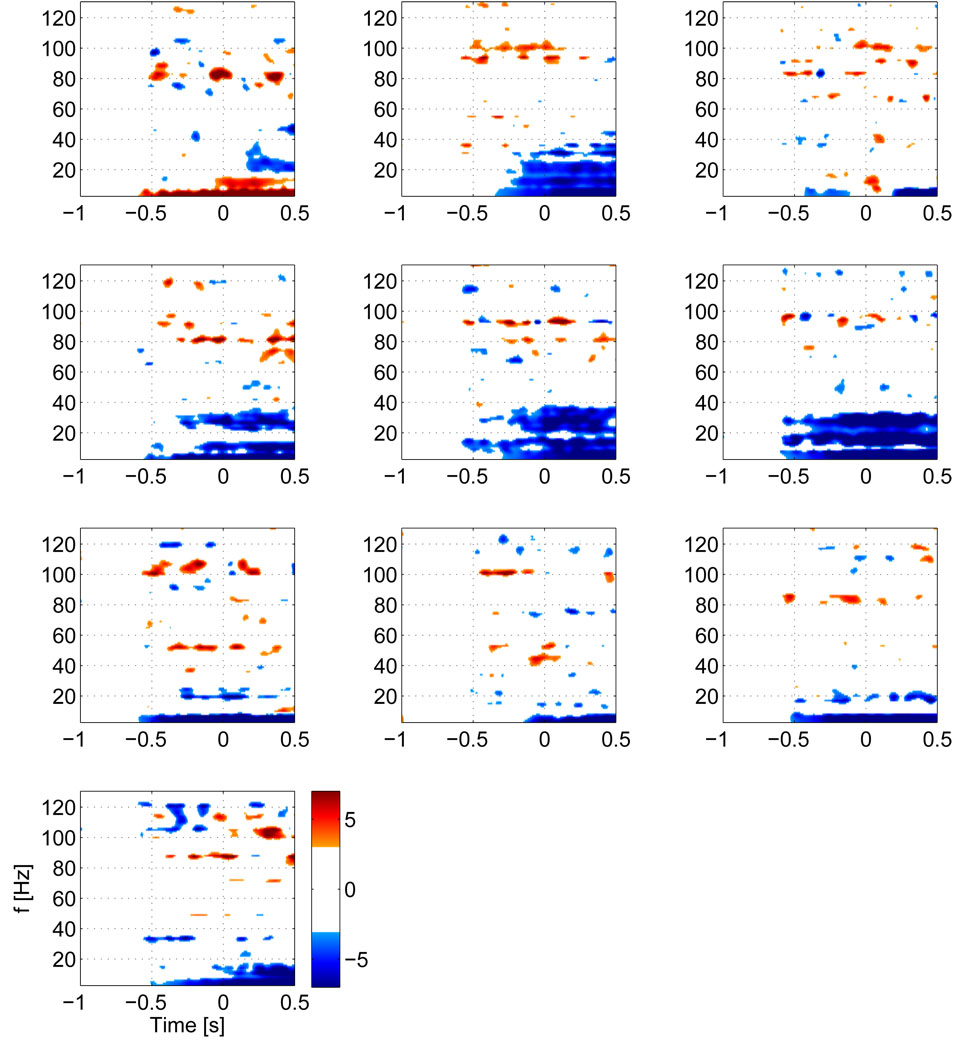
Figure 3.
Z-score TF maps for each subject for activity in the contralateral motor area. Note that subject 1, whose map is shown in the top left corner was left handed and performed a left index finger movement, hence activity in the right motor area is shown. All other subjects were right handed and hence all other maps show activity for the left motor area. The maps have a threshold at ‖Z‖ ≥ 3, which corresponds to an uncorrected p-value ≤ 0.01. The individual maps show, that all subjects have significant pre-movement HG increases in a narrow band.

