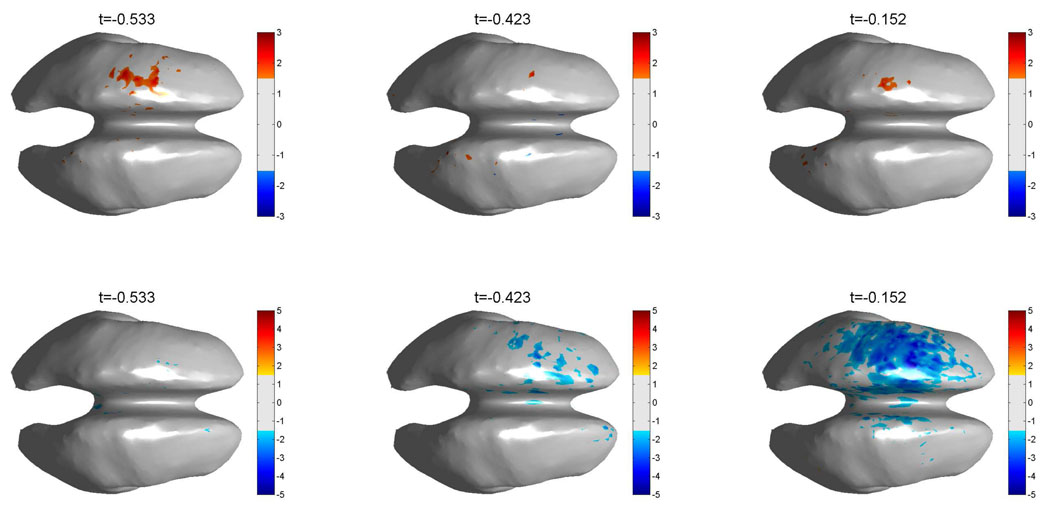
Figure 6.
Group average maps for all right handed subjects (n = 9). The top row shows the average HG activity across all subjects for three pre EMG onset latencies. The bottom row shows the corresponding beta band (15–35 Hz) activity. The band power maps for each subject have been converted to Z-scores, based on the −1 s to −0.6 s interval, prior to averaging. A threshold of ‖Z‖ ≥ 1.5 is used for both, HG and beta band activity. Note that, since we average over nine subjects, only values exceeding 4.5 std are shown, corresponding to an uncorrected p ≤ 2 * 10−10 for each voxel. These maps show, that HG and Beta band changes in the motor areas are the dominant activity.

