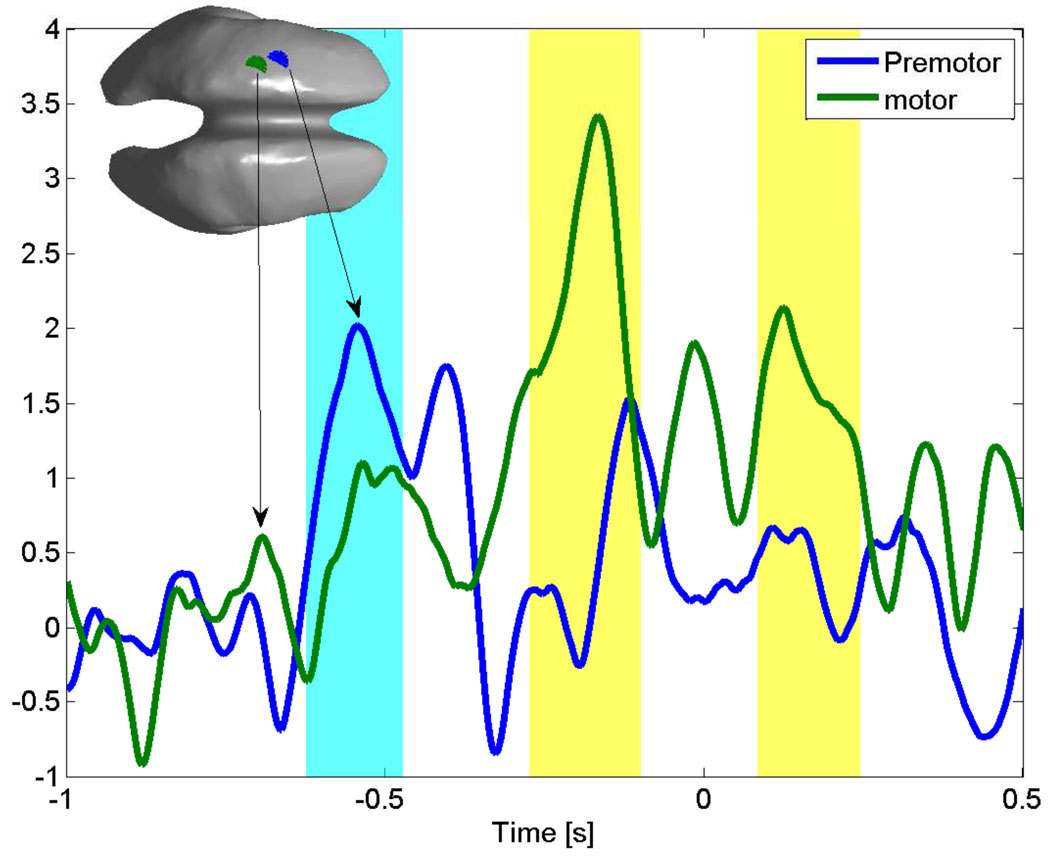
Figure 7.
Time series for the premotor (blue line) and motor area (green line) of the group average HG activity. The shaded areas (cyan for the premotor activity and yellow for motor activity) indicate the times, where the lower bound of the 95% confidence interval for each time series exceeds the mean baseline activity. The inset shows the position of the premotor (blue) and motor (green) voxels on the generic cortex. The premotor area activity peak (blue) precedes the motor area (green) peak.

