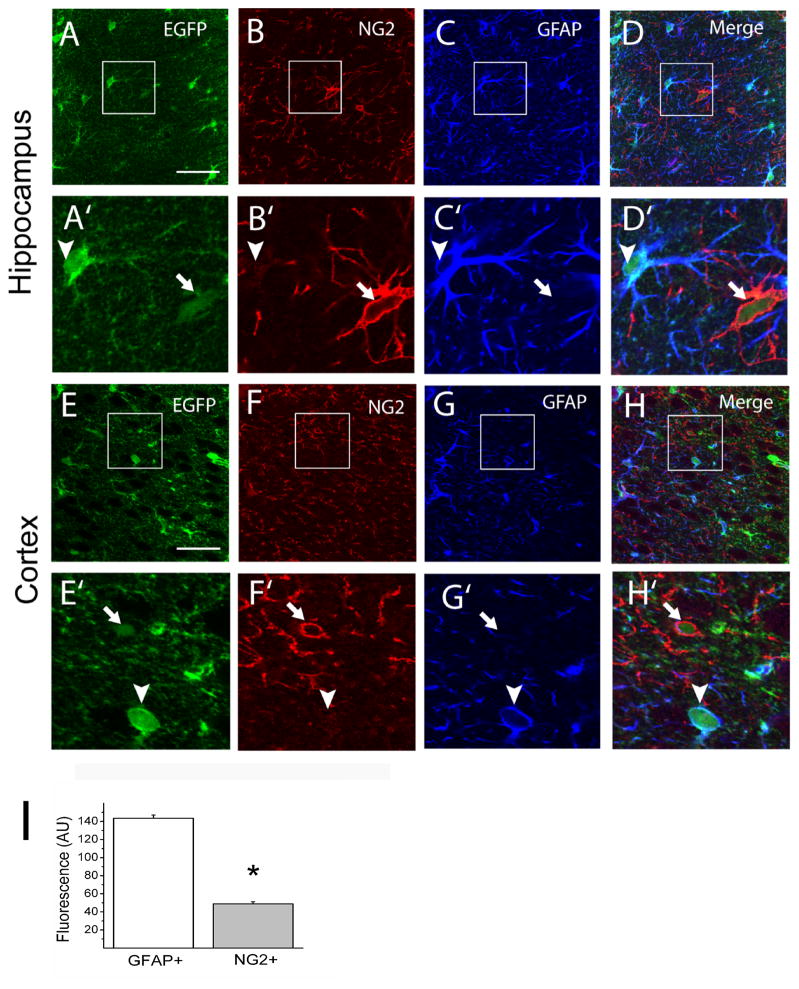
Figure 3. Kir4.1 is highly expressed in GFAP+ glia and weakly expressed in NG2+ glia in the gray matter of Kir4.1-EGFP mouse brain.
(A–H) Triple labeling of brain sections for Enhanced green fluorescent protein (EGFP), chondroitin sulfate proteoglycan NG2 (NG2) and Glial fibrillary acidic protein (GFAP). Areas in the small squares are enlarged in corresponding lower figures. Arrowheads indicate GFAP+ cells while arrows indicate NG2+ cells. (I) The EGFP signal for the soma of cells identified as either GFAP+ (n = 264) or NG2+ (n = 103) was quantified and shown as fluorescence intensity in arbitrary units, * P< 0.05. Scale bars: 50 μm (A, E).

