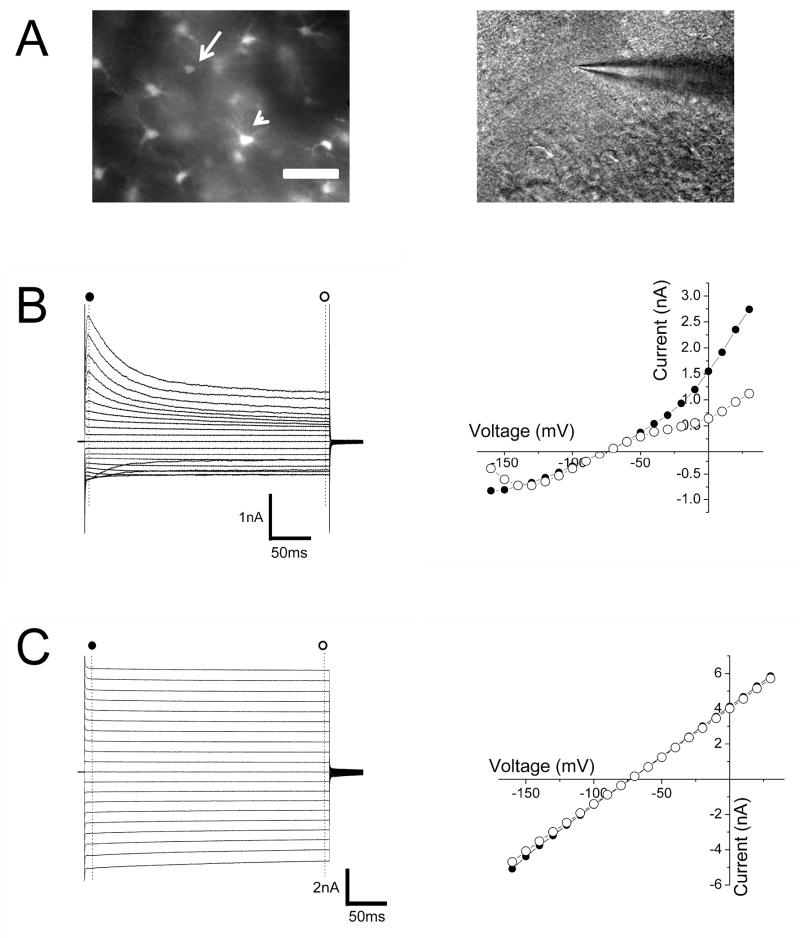
Figure 4. Weakly and brightly fluorescent glia in CA1 of hippocampus display distinct functional properties.
(A) Left panel shows epifluorescence image of weakly (arrow) and brightly (arrowhead) fluorescent glia. DIC image in the right panel shows the recording pipette in the weakly fluorescent cell shown in the left panel magnification. (B,C) Currents elicited and I-V relationship upon voltage steps from −160 to +30 mV in weakly (B) and brightly (C) fluorescent cells at the beginning (●) and the end of the pulse (○). Scale bar: 50 μm (A).

