
FIGURE 1.
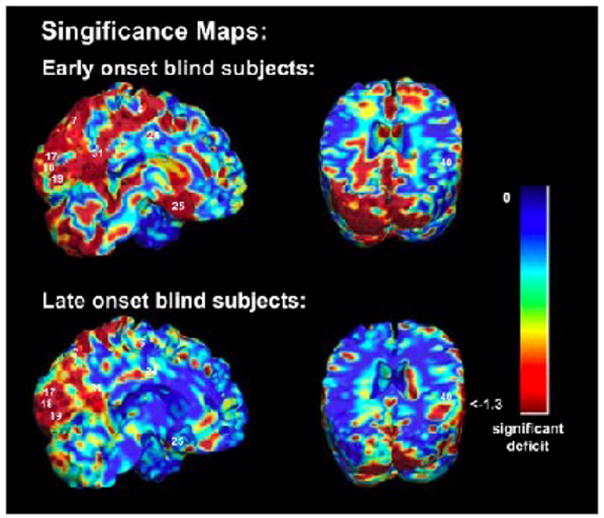
Structural differences and Brodmann areas. Occipital brain regions show highly significant structural differences associated with blindness for the EB (top) and LB (bottom) groups, after adjusting for individual differences in brain scale. Numbers on the map represent approximate Brodmann areas. The color bar shows the local significance of the group differences.