
FIGURE 3.
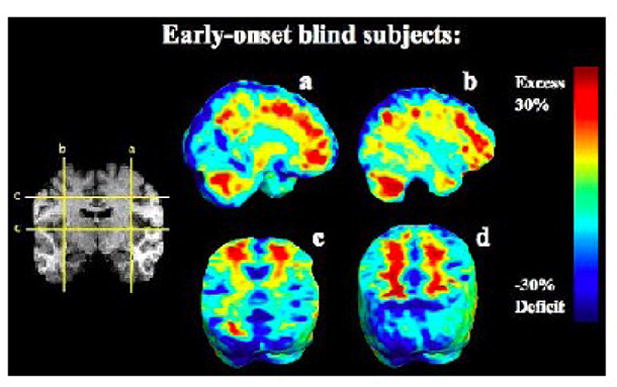
Maps of Volume Differences without Adjustment for Overall Brain Scale (Unscaled). The maps show the ratio of the mean volume in the EBs relative to that of the sighted controls at each voxel for the unscaled data. The color bar displays the difference in average volume, between groups, as a percentage of the mean volume in controls. The EB group shows prominent and widespread hypertrophy of the white matter (red colors) in regions outside the occipital lobes.