
FIGURE 4.
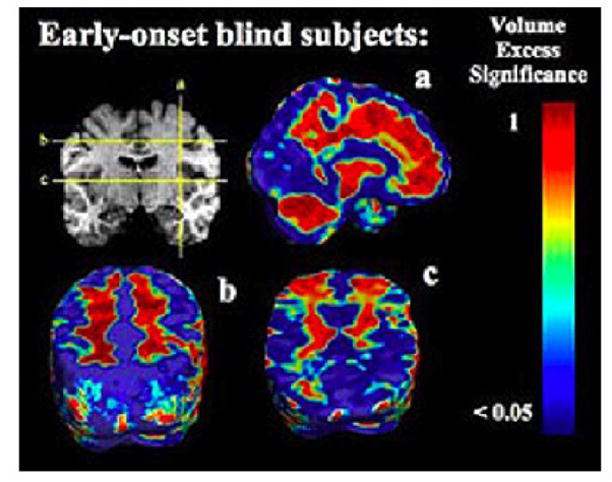
P-values for unscaled EBs versus controls. This figure shows the significance of volume differences between EB versus sighted subjects for the unscaled data (i.e., in data not adjusted for inter-individual differences in overall brain scale). Top panel: p-values for volume excess in EB compared to controls. Bottom panel: p-values for volume deficits in EB versus controls. The p-values are shown on a log10 scale, with dark red values showing significance at the level of 0.05. The corrected p-value for the whole brain was found to be p=0.03 from permutation tests, showing that observed pattern is significant overall.