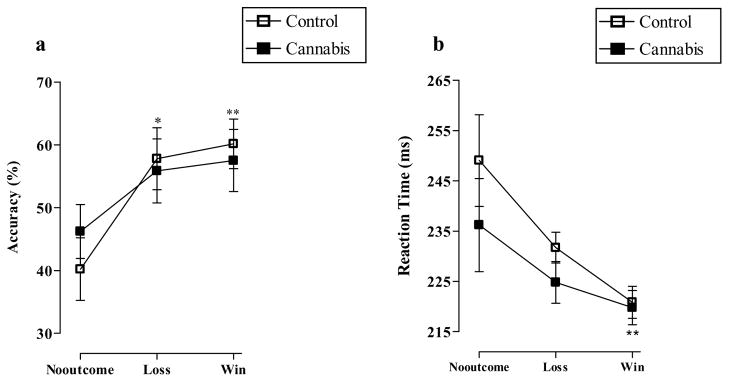
Figure 2.
a) Mean percentage accuracy (*p<0.05 “loss” versus “no-outcome”, **p<0.01 “win” versus “no-outcome”) and b) mean reaction time (milliseconds) (**p<0.01 “win” versus “no-outcome”) in the controls and cannabis users on the MID task (means and standard errors). Data were analyzed using two (group) x three (cue) univariate analyses

