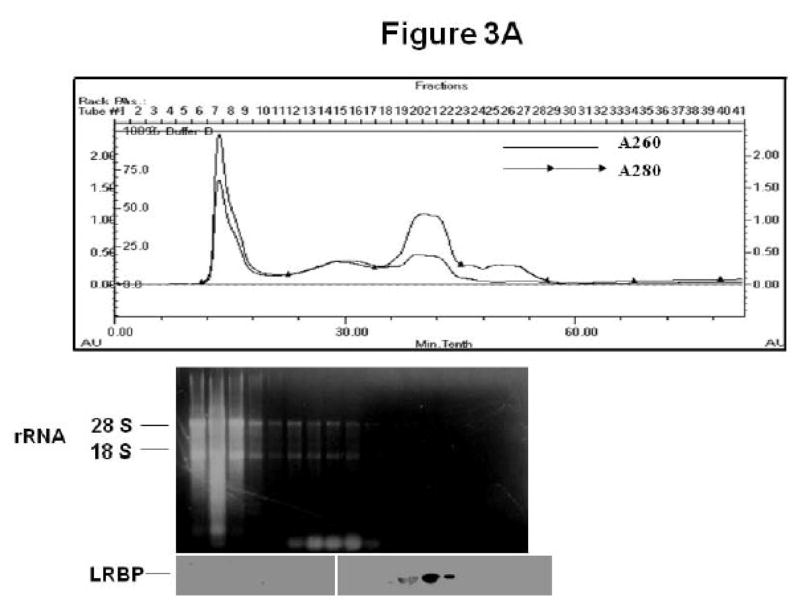
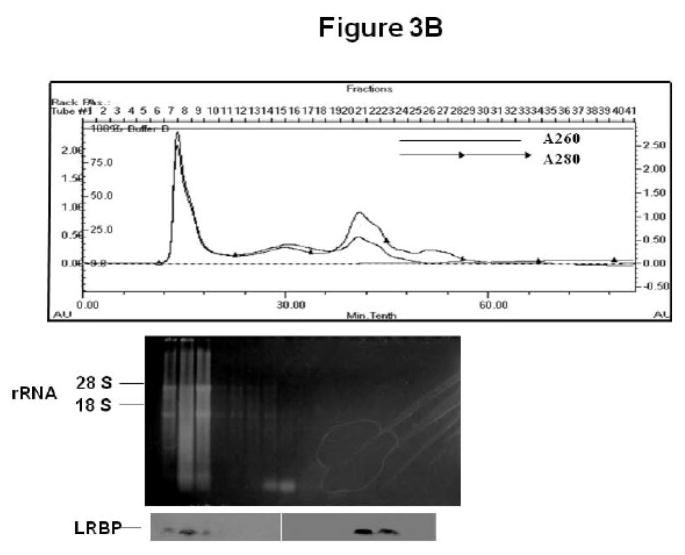
Fig 3. Gel filtration chromatography of post-mitochondrial supernatants from control (CTL; A) and downregulated (hCG; B) ovaries.
Rats were injected with hCG or saline on the fifth day of pseudopregnancy, ovaries were collected after 4 h and the S10 fractions were subjected to FPLC-assisted gel filtration. The top panels in A and B show the absorbance profile at 280 and 260 nm. The middle panels show the agarose gel electrophoresis profile of RNA extracted from fractions 7–24 from the gel filtration column, placed under the corresponding fractions in the absorbance profile. The bottom panels show Western blot analysis to detect LRBP using LRBP antibody in fractions 7–24, with the LRBP lanes placed directly under the corresponding fractions of the absorbance profile.


