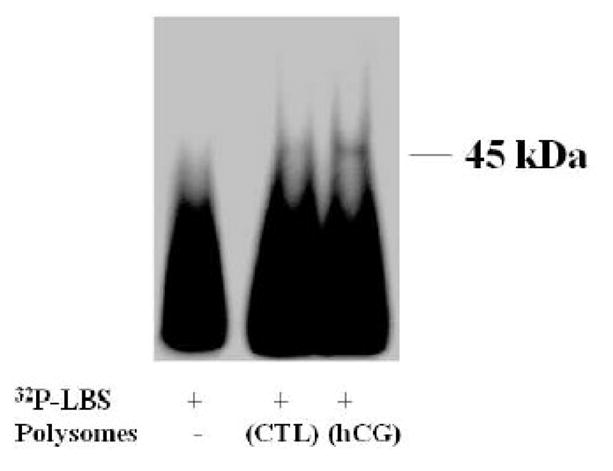
Fig 6. RNA mobility shift analysis.

Gel mobility shift analysis was performed with [32p] labeled rat LBS (1.5 × 10⁵ c.p.m) using no protein (LBS only), or equal amounts of protein from the RSW extracted from control (CTL) and 4 h hCG-treated ovaries (hCG), as described in Materials and Methods. The autoradiogram shown is representative of three independent experiments.
