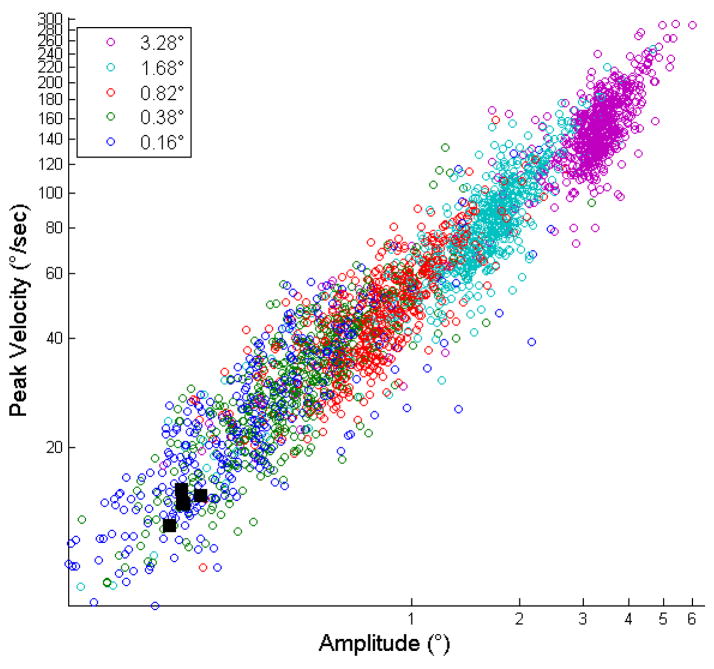
Figure 3.
Measured saccade amplitudes from experiment 1 plotted on a log-log scale against their peak velocities, color coded to indicate the actual size of the fixation point jump, revealing that all measured saccades fall on the same main sequence. The five black squares indicate the mean magnitude of microsaccades measured for each subject. These are the means of the data shown in Figure 5, and reveal that microsaccades fall on the same main sequence as saccades.

