Figure 5.
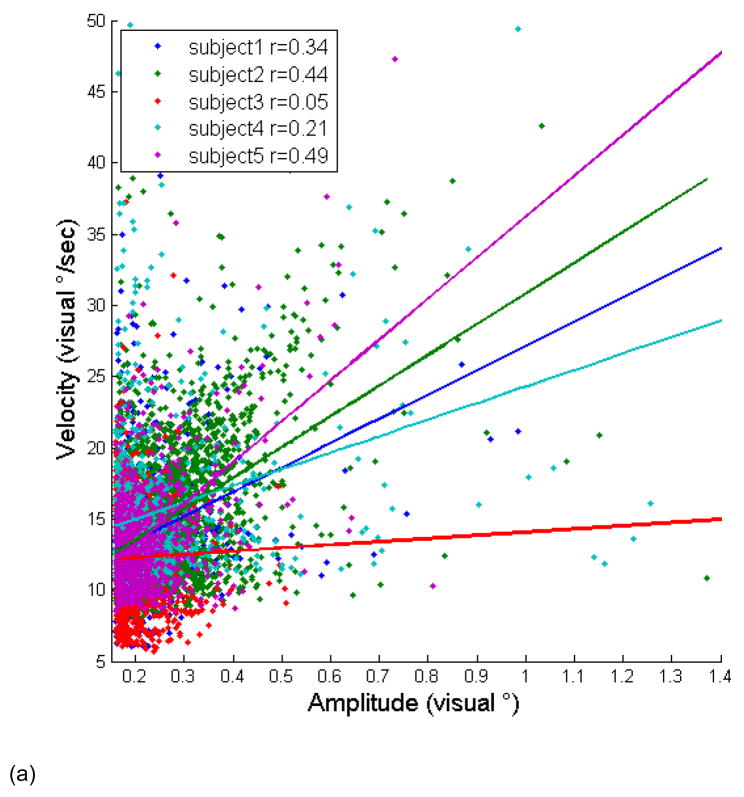
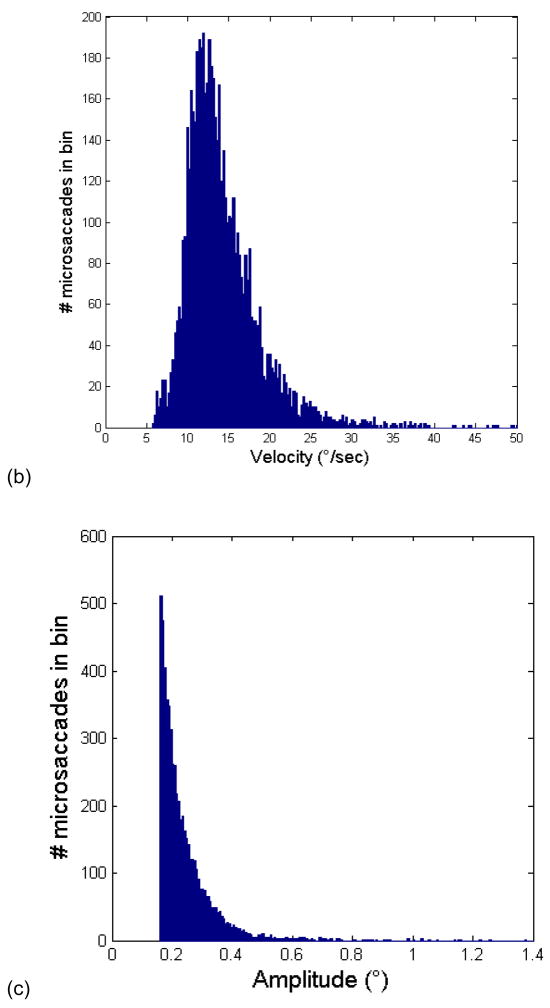
(a) Main sequence of detected microsaccades from experiment 2, plotting microsaccade amplitude against peak velocity. Superimposed in the corresponding color is the regression line that best fits a given subject’s data. Values of the correlation coefficient r are given in the legend. Note that only the three highest correlation coefficient subjects’ data was used in averaging BOLD signal deconvolution timecourses (see Fig. 7). (b) Histogram of the velocities of detected microsaccades. (c) Histogram of the amplitudes of detected microsaccades. Data below x=0.16 are not shown because we did not count as microsaccades visual events whose amplitude was less than 0.16 visual degress.


