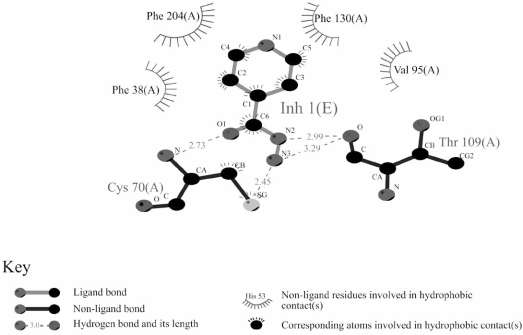
Fig. (4). Interactions of isoniazid with the active site of NAT from M. smegmatis.
The interactions are shown using Ligplot analysis [65]. Inh1 (E) indicates isoniazid. The residues are indicated by their numbers in M. smegmatis NAT. After [7]. An identical Ligplot for M. marinum NAT is found in [43].

