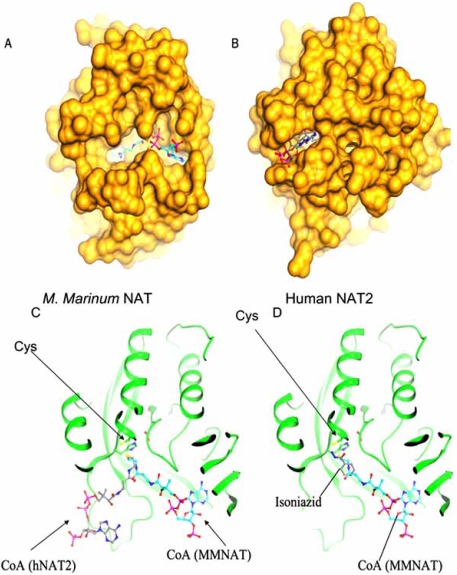
Fig. (5). Comparison of the interaction of CoA with NAT from M. marinum and human NAT2.
Molecular surface representations of M. marinum NAT with CoA bound (pdb 2vfc) (A) with human NAT2 with CoA bound (pdb 2pfr) (B). The CoA is shown in ball and stick representation. Ribbon representation of the binding of M marinum NAT (MMNAT) with CoA bound (dark ribbon) compared with CoA bound to human NAT2(hNAT2) (light ribbon). The structures have been overlaid and the CoA molecules are shown in ball and stick representation, as are the residues of the active site triad (Cys indicated by an arrow) (C). Frame (D) shows the location of isoniazid in the active site, in relation to the position of CoA in the structure of M. marinum NAT. Isoniazid and CoA are shown in ball and stick representation and the active site resides are just visible, with Cys being indicated by an arrow. After [43].

