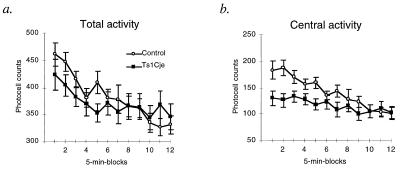
Figure 4.
Spontaneous locomotor activity of control (n = 14) and Ts1Cje mice (n = 16). The activity is shown in 12 sequential blocks of 5 min each. (a) Total activity. The effect of genotype was not statistically significant (P = 0.62). Activity decreased over blocks (P = 0.0003), but there was no statistically significant block by genotype interaction (P = 0.12). (b) Activity in the central region. Activity decreased over blocks (P = 0.011), but there was no statistically significant block by genotype interaction (P = 0.20). Although the effect of genotype was not statistically significant (P = 0.06), the activity of Ts1Cje was significantly lower than that of controls in blocks 1–3 (block 1, P = 0.017; block 2, P = 0.0037; block 3, P = 0.0035). In addition, the change in central activity from block 1 to block 12 was less in the Ts1Cje mice than in the controls (P = 0.046).

