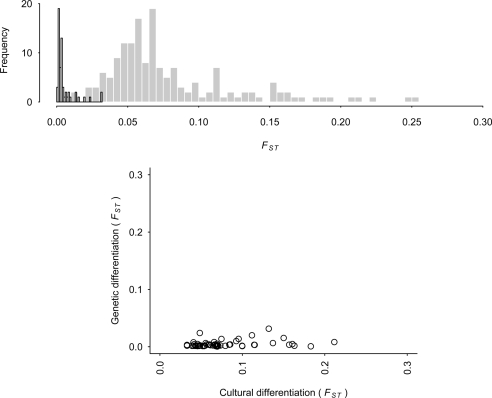
Fig. 1.
Comparison of genetic and cultural differentiation. Above: Histogram of 150 cultural FST (gray fill) and 59 genetic FST (black border) for neighboring countries calculated from the World Values Survey and in (24), respectively. Bottom: Plot of the cultural against genetic FST for 59 pairs of neighboring countries.

