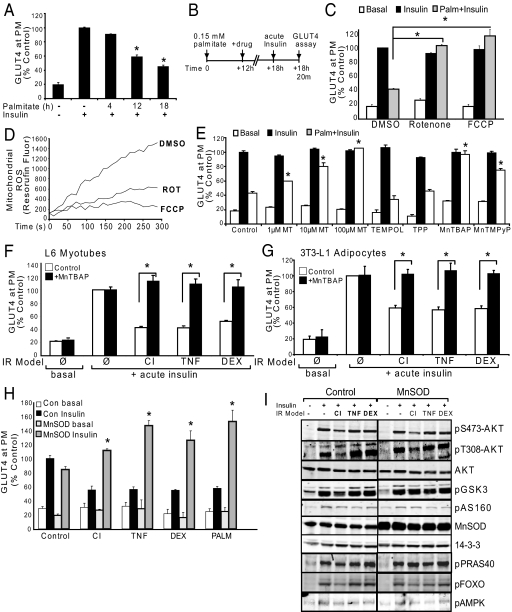
Fig. 2.
Inhibition of mitochondrial superoxide production reverses IR in vitro.(A) L6 myotubes were treated with carrier control or 0.15 mM palmitate for 4, 12, or 18 h before acute insulin stimulation and analysis of surface HA-GLUT4. (B) Experimental design. L6 myotubes become insulin resistant within the first 12 h of 0.15 mM PALM treatment (as shown in A). At this time the media was refreshed −/+ drug treatment for the final 6 h before acute insulin stimulation and analysis of PM-GLUT4. (C) Myotubes were incubated with 100 nM FCCP, 10 nM rotenone, or control (DMSO) for the final 6 h of 18 h 0.15 mM palmitate incubation as described in (B). (D) Isolated mitochondria from L6 cells were incubated in the presence of DMSO, 100 nM FCCP, or 10 nM Rotenone and Amplex Red oxidation to Resorufin was monitored as an indication of mitochondrial ROS production. Line tracings from a representative experiment are shown. (E) As described in (B), palmitate treated myotubes were incubated with the mitochondrial SOD mimetics MitoTEMPO (MT), 300 μM MnTBAP, 100 μM MnTMPyP, or controls water, TPP (1 mM), and TEMPOL (1 mM). All antioxidants except TEMPOL (cytoplasmic SOD mimetic) reversed palmitate-induced IR. (F–G) L6 myotubes (F) or 3T3-L1 adipocytes (G) were treated with CI, TNF, or DEX; during the final 6 h the cells were incubated with control (water, open bars) or MnTBAP (300 μM, black bars). (H) L6 myotubes overexpressing MnSOD were protected from PALM, CI, TNF, and DEX-induced IR whereas control cells displayed marked IR under the same conditions as defined by reduced insulin-stimulated surface HA-GLUT4. (I) Representative Western blots of MnSOD over-expressing myotubes and empty vector control myotubes treated with IR models. 14–3-3 is shown as a loading control. (A, C, E–G) Results are displayed as means ± SEM, n = 3.

