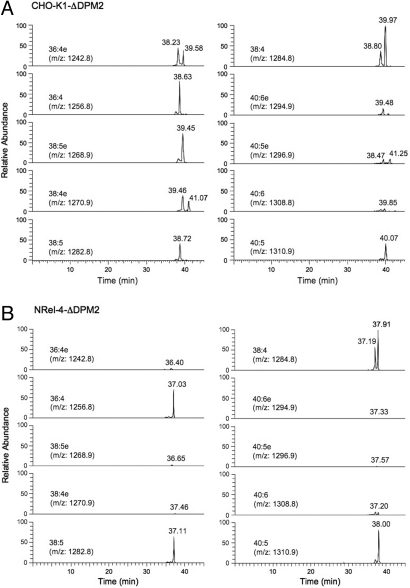
Fig. 4.
LC-Orbitrap mass spectrometric analysis of GlcN-acyl-PI accumulated in CHO-K1-ΔDPM2 (A) and NRel-4-ΔDPM2 (B) cells. Species of GlcN-acyl-PI with various fatty chain combinations are indicated as (total number of carbons):(number of unsaturated bonds). Those with e represent alkyl-acyl species and those without e represent diacyl species. Elution time from LC is shown in minutes.

