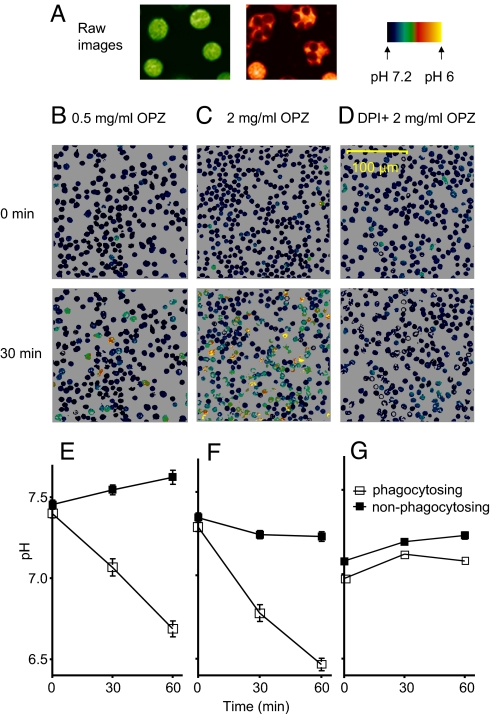
Fig. 1.
Only neutrophils that phagocytosed OPZ acidified. (A) Raw images at the 2 wavelengths ratioed for SEER (10), illustrating that cells that phagocytose OPZ (Right) can be readily distinguished. Human neutrophils were exposed to 0.5 mg/mL OPZ (B), 2 mg/mL OPZ (C), or 2 mg/mL OPZ with 20 μM DPI (D) at 0 min, and pHi was monitored in individual cells by SEER (10). (E) Mean (± SE) pHi decreased in 35 cells that phagocytosed in 0.5 mg/mL OPZ (□), whereas pHi increased in 43 cells that did not (■). (F) At 2.0 mg/mL OPZ, 41 phagocytosing cells acidified; the apparent decline in pHi in 29 nonphagocytosing cells may reflect a few miscategorized cells that engulfed OPZ surreptitiously, outside the plane of focus. (G) Despite a normal rate of phagocytosis (see text), no acidification occurred when the NADPH oxidase was inhibited by 20 μM DPI (■, 31 cells; □, 34 cells).

