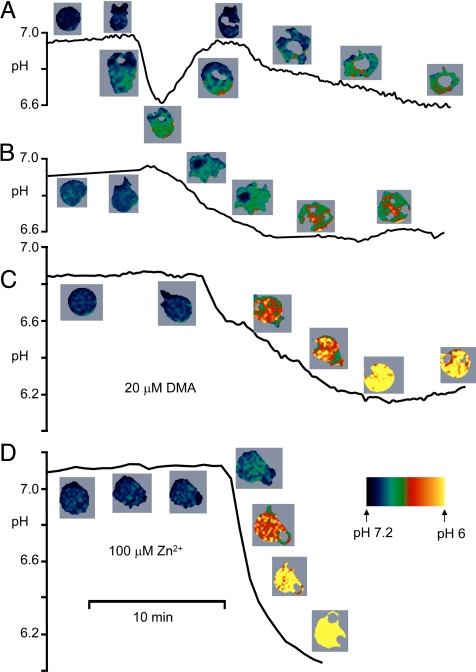
Fig. 2.
Time course of pHi changes in 4 phagocytosing neutrophils. Pseudocolor images of each cell are positioned near the corresponding time point. The spatially averaged pHi of the cell is plotted, including only areas of cytoplasm above a threshold level of fluorescence intensity; areas below the cutoff (e.g., in phagosomes) are blanked. Acidification invariably occurred rapidly after productive contact with OPZ, often followed by rapid recovery (A), but sometimes not (B). In cells pretreated with 20 μM DMA to inhibit Na+/H+ antiport (C), or 100 μM Zn2+ to inhibit proton current (D), pHi decreased farther and did not recover.

