Fig. 3.
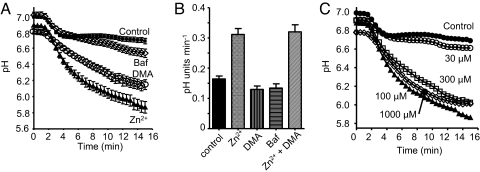
Temporal involvement of proton transporters during phagocytosis. (A) Average time course of pHi changes in individual phagocytosing neutrophils, retrospectively synchronized to the time they first engulfed OPZ (set at 1.5 min). Mean ± SE in 52 control cells (■), cells pretreated with 500 nM Baf (◇, n = 22), 20 μM DMA (○, n = 39), or 100 μM Zn2+ (▴, n = 52). (B) Maximum rate of pH change during the rapid acidification accompanying phagocytosis in neutrophils pretreated with 100 μM Zn2+, 20 μM DMA, or 500 nM Baf. The rate determined from the steepest slope in each cell is plotted (mean ± SE) for 129 control, 50 Zn2+ (P < 0.0001), 39 DMA, 39 Baf, and 12 Zn2++DMA treated cells. (C) Concentration-dependent effects of Zn2+ on pHi. Average time course of pHi changes in synchronized phagocytosing neutrophils in the presence of 0 (●, 52 cells), 30 (○, 38 cells), 100 (▴, 52 cells), 300 μM Zn2+ (□, 42 cells), or 1 mM Zn2+ (◇, 52 cells). Error bars are omitted for clarity; data at 100 μM, 300 μM, or 1 mM Zn2+ all differed significantly from control, but not from each other. The data at 0 and 100 μM Zn2+ are the same as in (A).

