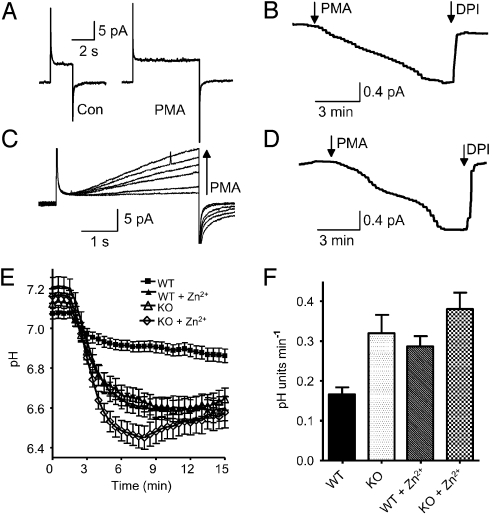
Fig. 5.
Responses to OPZ of bone marrow phagocytes from WT and HVCN1 deficient (KO) mice. (A) Phagocytes from KO mice have no proton current. Currents are for pulses to +100 mV before (Left) and after (Right) 150 nM PMA. (B) Electron current elicited by PMA in the same cell at +20 mV, showing inhibition by 20 μM DPI, an NADPH oxidase inhibitor. (C) PMA response of WT proton currents during pulses to +80 mV applied at 1-min intervals before and after PMA. (D) Electron current elicited by PMA at −40 mV in the same cell. (E) Average time course of pHi in mouse bone marrow phagocytes exposed to OPZ. Each cell was retrospectively synchronized so the first phagocytotic event occurred at 1.5 min. Measurements in cells from 3 different mice are combined for each condition. Mean ± SEM is plotted for 32 WT cells (■), 21 WT cells with 100 μM Zn2+ (▴), 23 KO cells (▵), and 18 KO cells with 100 μM Zn2+ (◇). At 6 min, KO, KO+Zn2+, and WT+Zn2+ all differ significantly from control (P < 0.01), but not from each other, with the exception that KO+Zn2+ differs from KO (P < 0.05). (F) Maximum rate of pHi decrease during the initial phagocytotic event in mouse bone marrow phagocytes. Mean ± SEM is plotted for 34 WT cells, 22 WT cells with 100 μM Zn2+, 24 KO cells, and 18 KO cells with 100 μM Zn2+. All data differ from WT (P < 0.001), but not from each other.

