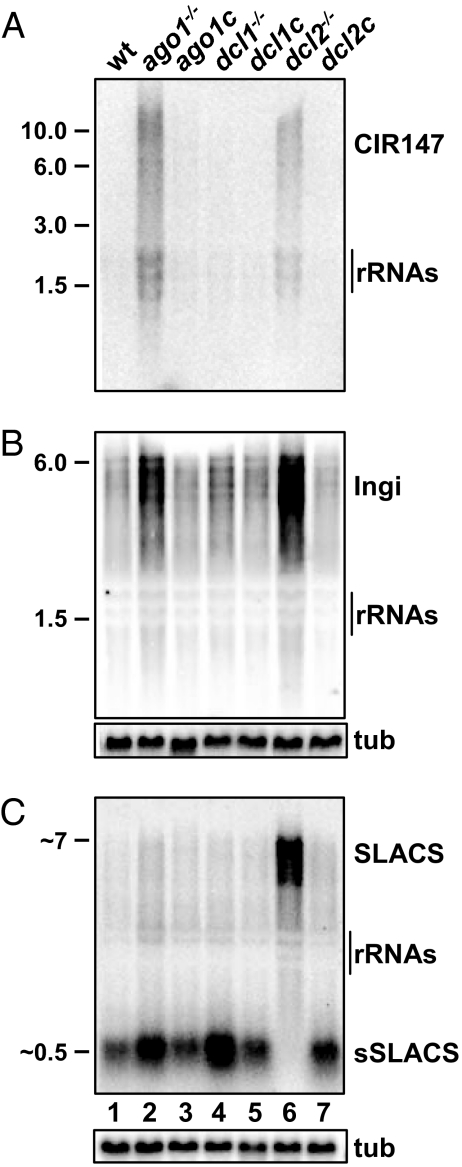
Fig. 4.
Expression pattern of steady-state RNA. Northern blot of total RNA isolated from various cell lines as indicated above each lane. The membrane was hybridized to a CIR147-specific probe (A), an Ingi-specific probe (B), or a SLACS-specific probe (C), and α-tubulin (tub) served as a loading control. Approximate sizes in kb are indicated (Left).

