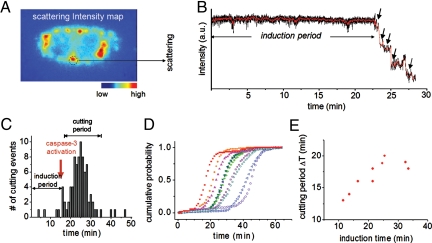
Fig. 4.
Single-particle traces in live cells as a function of time. (A) Scattering intensity map of a single cell having internalized multiple-crown nanoparticles plasmon rulers. (B) Trajectory of a single-crown nanoparticle upon addition of TNF-α/CHX. Stepwise decreases in signal intensity were observed, which correspond to the sequential cleavage of satellite nanoparticles by caspase-3. (C and D) Statistical analyses of crown nanoparticle cleavages in a single cell as a function of time (C). Only minimal proteolysis was observed from 0 min to 16 min. Then, a rapid increase in cleavages occurs in the period from 16 to 35 min, indicative of caspase-3 activation. Caspase-3-mediated proteolysis of 10 different cells in a group (D). Differences in induction times across cells in the same population reflect cell-by-cell heterogeneity against caspase-3 activation. (E) A plot of the induction time (i.e., time from addition of apoptotic inducer until 5% of cleavages have occurred) vs. the cutting period (i.e., time following the induction period and ending when 95% of cleavages have occurred) of crown nanoparticle plasmon rulers. A slower cleavage rate was observed from cells exhibiting a longer induction time for initial cleavage.

