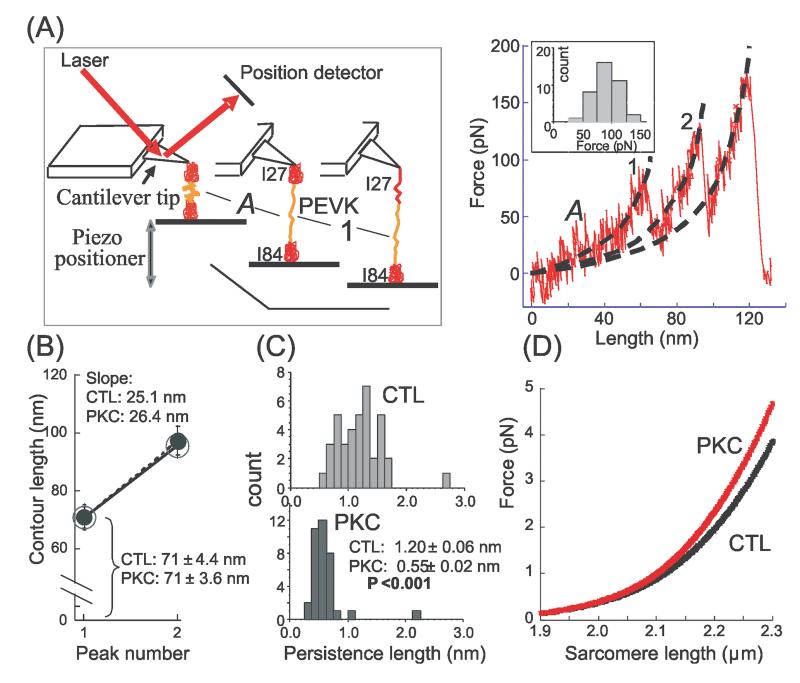
Figure 4. Effect of PKCα phosphorylation on single PEVK molecule mechanics.
A) Left: Schematic of atomic force microscope (AFM) experiment with a construct containing the PEVK and its flanking Ig domains (Ig27 and Ig84); Right: representative force-extension curve. Stage ‘A’ refers to PEVK extension and ‘1’ to unfolding of the first Ig domain (either Ig27 or Ig84). Subsequently, the second Ig domain unfolds giving rise to a second force peak; the third peak is due to detachment of the molecule. Dashed black lines represent WLC fits that were used to determine the contour length (CL) and persistence length (PL) with values obtained for stage ‘A’ representing the PEVK. Inset shows the unfolding force histogram for the first unfolding peak (mean value 90 ± 3 pN). B) CL of PEVK (peak 1) and PEVK plus one unfolded Ig domain (peak 2). Nonphosphorylated (CTL): large open circle (n = 38); phosphorylated (PKC): small closed circle (n = 36). Phosphorylation has no effect on CLs. The shown slopes represent the contour-length-gain due to Ig domain unfolding; slopes are unaffected by PKC. C) PEVK PL histograms before (CTL, top) and after (PKC, bottom) PKC phosphorylation. Distribution is shifted to lower values following phosphorylation; mean PL value is significantly reduced. D) Calculated effect of PEVK PL reduction from 1.2 to 0.55 nm on force-sarcomere length curve of a single titin molecule (cardiac N2B isoform).

