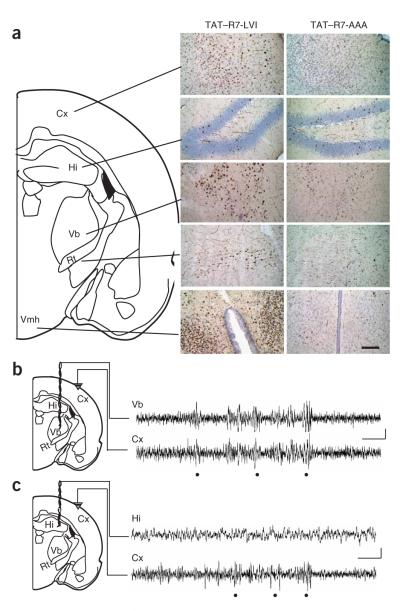
Figure 4.
Region-specific absence seizures induced by disruption of mGluR7a-PDZ ligand interactions. (a) Immunolabeling of c-fos in brain sections from rats that were intravenously injected with either TAT—R7-LVI or TAT—R7-AAA peptide. Scale bar represents 100 μm. (b) Cortical and thalamic EEG recordings in a rat 30 min after intravenous injection with the TAT—R7-LVI peptide. Dots show concomitant discharges in the two structures. (c) Cortical and hippocampal EEG recordings in a rat 30 min after intravenous injection of TAT—R7-LVI peptide. Dots show EEG discharges in the cortex. Scale bars represent 1 s and 100 μVin b and c.

