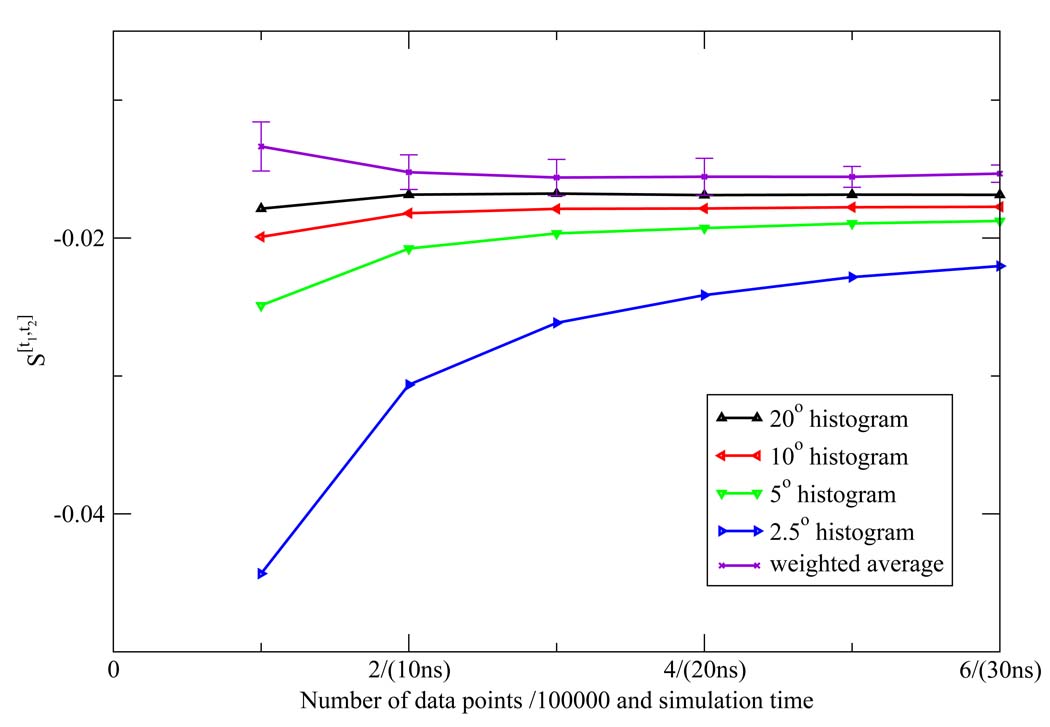
Figure 6.
The third shell orientational Shannon entropy S[t1,t2] for the TIP3P model as a function of the number of data points (labeled on the horizontal axis in front of "/" in units of 100000) and the corresponding simulation time (labeled on the horizontal axis in parentheses) using histogram method. The weighted average of the NN estimates and the associated error bar were also depicted.

