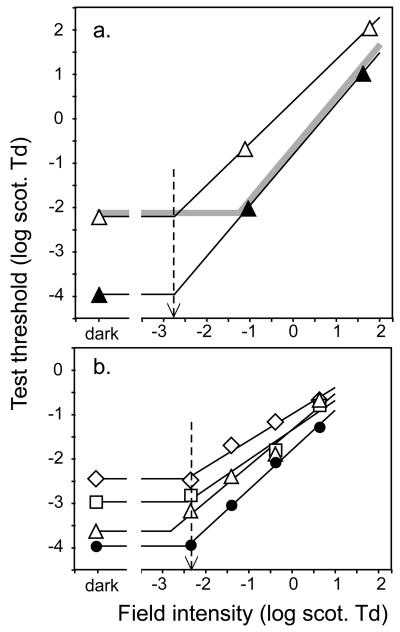
Figure 2.
Rod increment threshold functions on infants and adults. Horizontal lines: absolute threshold of each data set, which measures test sensitivity; sloping lines: regression lines fitted to the increment threshold data; dashed arrows: the measured field sensitivity, where the two solid lines cross. Gray curve: infant data predicted by an early-stage immaturity. A, 7-week-olds (white triangles) and adults (black circles), from ref. 20. B, 4-week-olds (diamonds), 10-week-olds (squares), 18-week-olds (triangles), and adults (black circles), from ref. 25.

