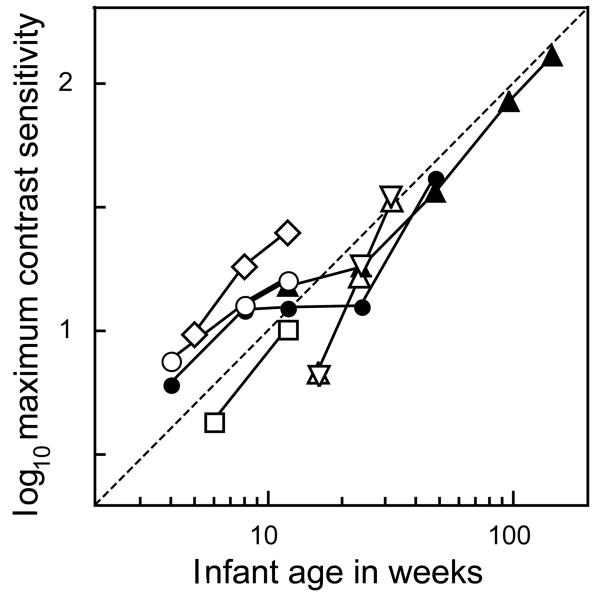
Figure 3.
Maximum infant contrast sensitivity, measured using static sinewave stimuli. White symbols, FPL data: diamonds, ref. 36; circles, ref. 37; squares, ref. 38; upright triangles, ref. 39; inverted triangles, ref. 40. Black symbols: acuity-card-style preferential looking data: circles, ref. 41; triangles, ref. 42. The dotted fiducial line of unit slope suggests that infant contrast sensitivity is numerically near the subject's age in weeks, and improves approximately proportionately to age in weeks.

