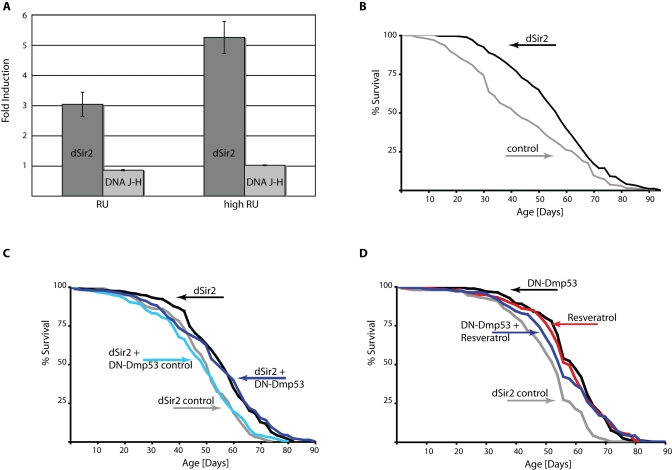
Figure 2. DN-Dmp53-dependent life span extension is not additive to life span extension caused by dSir2 activation.
(A) Quantitative PCR analysis of gene induction dynamics in ELAV-Switch-EP2300 flies. Flies were raised on food containing two different doses of RU486 and harvested at day 10 of adult life. Induction of transcripts for the two genes affected by the P-element insertion (dark grey: dSir2; light grey: DNA J-H) compared to flies raised on control food were analyzed. Shown is a representative of three independent experiments (p=0.0037 for comparison of the dSir2 mRNA levels between normal and high RU doses). (B) Survivorship curves of female flies expressing dSir2 due to high dose RU486 treatment (grey: control; black: dSir2) show increased median life span extension of 38% (compare to [6], Table 1). (C) Survivorship curves of female ELAV-Switch flies expressing dSir2 alone or together with DN-Dmp53 raised on 1.5N food. Flies expressing dSir2 alone on normal RU486 conditions have median life span extended by 10% (grey: control; median life span 51 days; black dSir2; median life span 56 days). Flies additionally expressing DN-Dmp53 have an extended median life span of 10% (light blue: control; median life span 50 days; dark blue: dSir2 + DN-Dmp53; median life span 55 days), which is similar to the effects of dSir2 expression alone.(D) Survivorship curves of female ELAV-Switch flies expressing DN-Dmp53 with or without resveratrol treatment raised on 1.5N food. DN-Dmp53 expression alone extends median life span by 11% (grey: control; median life span 54 days; black: DN-Dmp53; median life span 60 days). Treatment of control flies with 200μM resveratrol extends median life span by 7% (red; median life span 58 days). When the two treatments are combined, median life span is extended by 4% (blue; median life span 56 days), revealing no additive effects on life span (shown are representative experiments (a selection of repetitions is shown in supplementary Figure 2); for statistical analysis of survivorship curves please refer to Table 1).

