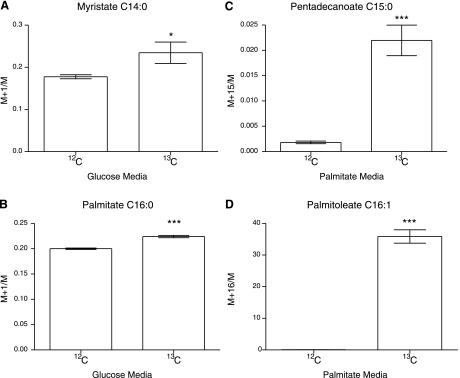
Fig. 6.
A: graph showing GC-MS M+1/M ion ratio for myristate when using 1-13C-glucose and unlabeled glucose, showing enrichment of myristate. B: graph showing GC-MS M+1/M ion ratio for palmitate when using 1-13C-glucose and unlabeled glucose, showing enrichment of palmitate. C: graph showing GC-MS M+1/M ion ratio for pentadecanoate when using U-13C-palmitate and unlabeled palmitate, showing enrichment of pentadecanoate. D: graph showing GC-MS M+1/M ion ratio for palmitoleate when using U-13C-palmitate and unlabeled palmitate, showing enrichment of palmitoleate. *P < 0.05, ***P < 0.005.

