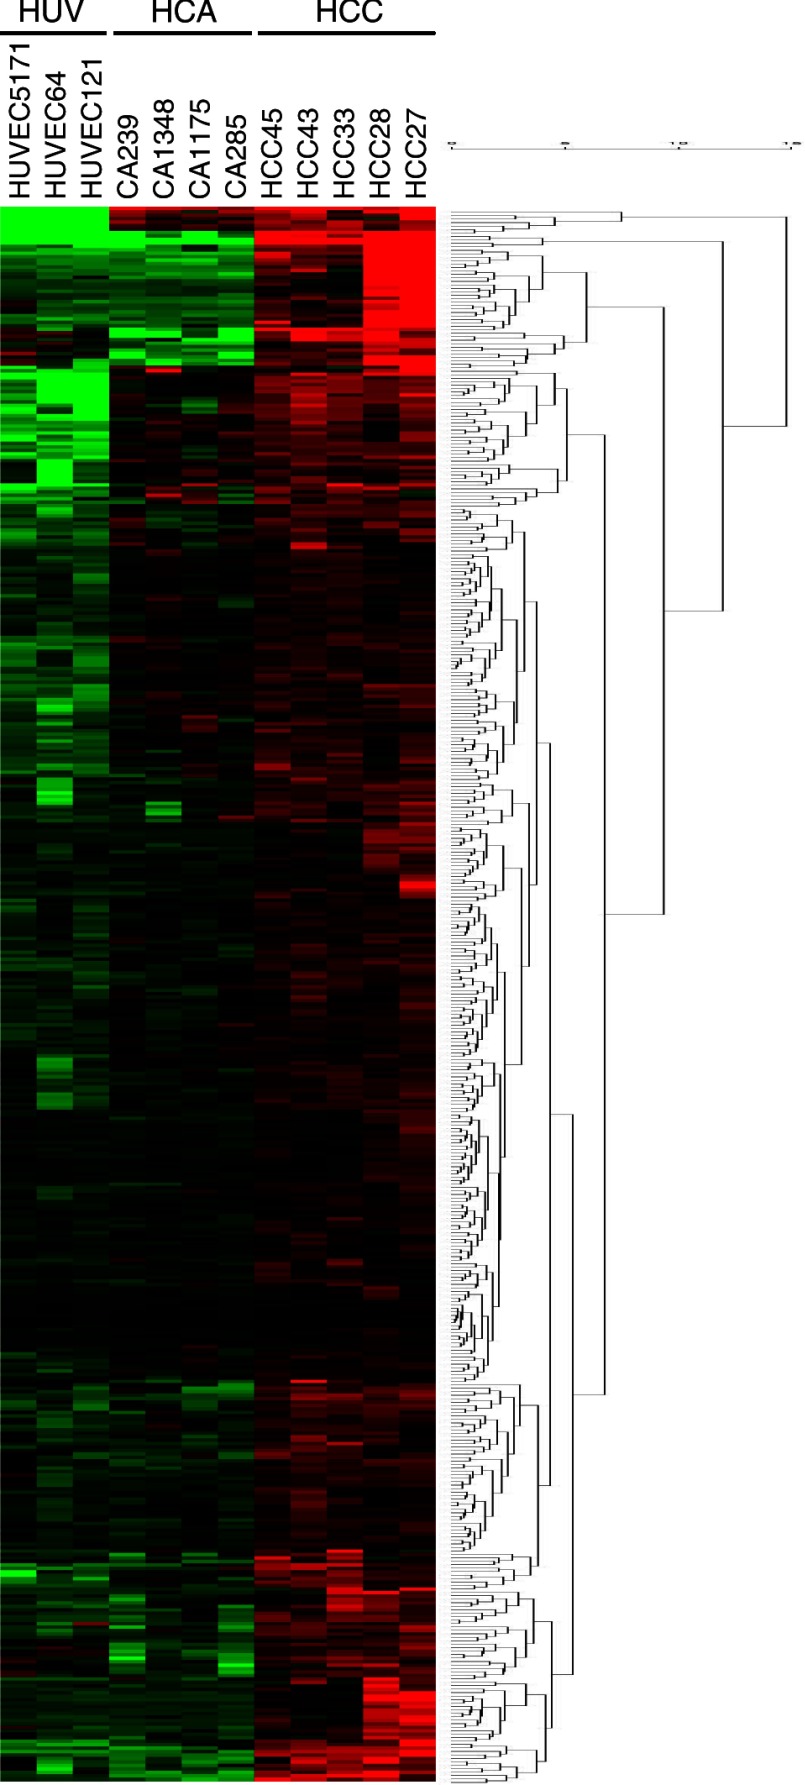
Fig. 2.
Heat map and dendrogram showing partition clustering of genes most highly expressed in HCCEC vs. HCAEC and HUVEC. The heat map shows the intensity of expression as a function of color, with higher expression in red and lower expression in green or black. A complete list of all 253 transcripts identified by GeneSifter as highly expressed in HCCEC is shown in Supplemental Fig. B.

