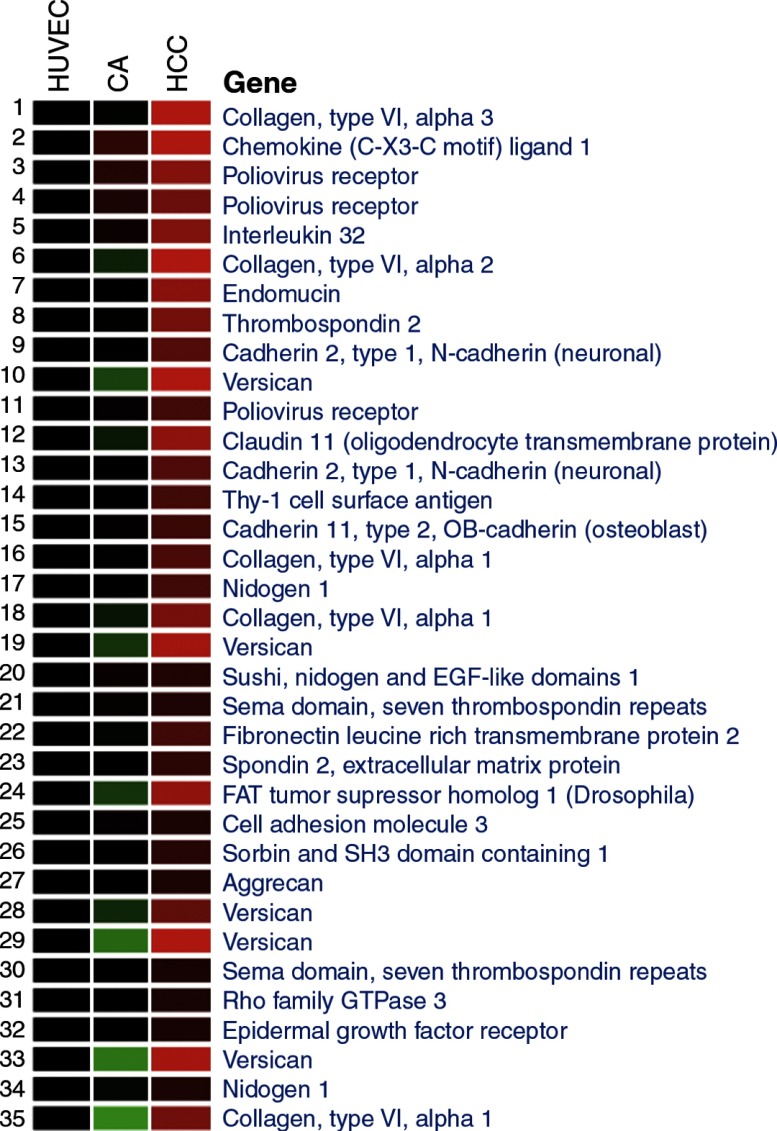
Fig. 3.
Heat map showing cell adhesion genes highly expressed in HCCEC. We determined by Gene Ontology the numerous cell matrix and cell surface adhesion genes differentially expressed in the HCCEC. Intensity of expression is displayed as mean values as a function of color, with higher expression in red and lower expression in green or black.

