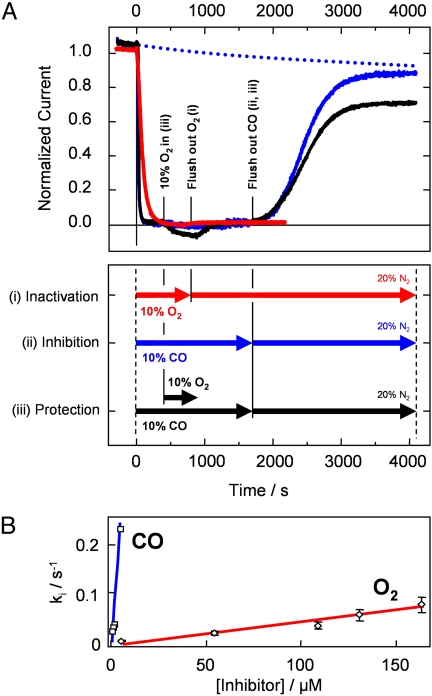
Fig. 3.
Inactivation of CrHydA1 by O2 as compared to inhibition by CO, and protection by CO against O2 inactivation. (A) Inactivation and inhibition by 10% O2 (i, red trace) and 10% CO (ii, blue trace) by gas exchange. The black trace shows an experiment in which the enzyme was subjected to 10% O2 after being fully inhibited by 10% CO (iii). The dotted line gives a visual guide to the progression of background film loss. Experimental conditions: pH 6.0, 20 °C, electrode rotation rate 3,000 rpm, −0.05 V vs. SHE, gas mixtures in the headspace as indicated, with 80% H2 and balance of N2 making up the remainder of the headspace atmosphere. The timeline shown in the lower panel provides a guide for the sequence of gas changes. (B) Dependence of rate of inactivation on concentration of O2 (diamonds, red) and CO (squares, blue). Note the rates of inactivation by CO were calculated by performing experiments such as those shown in Fig. 2, that is, by simultaneous injection of CO-saturated buffer and gas exchange.

