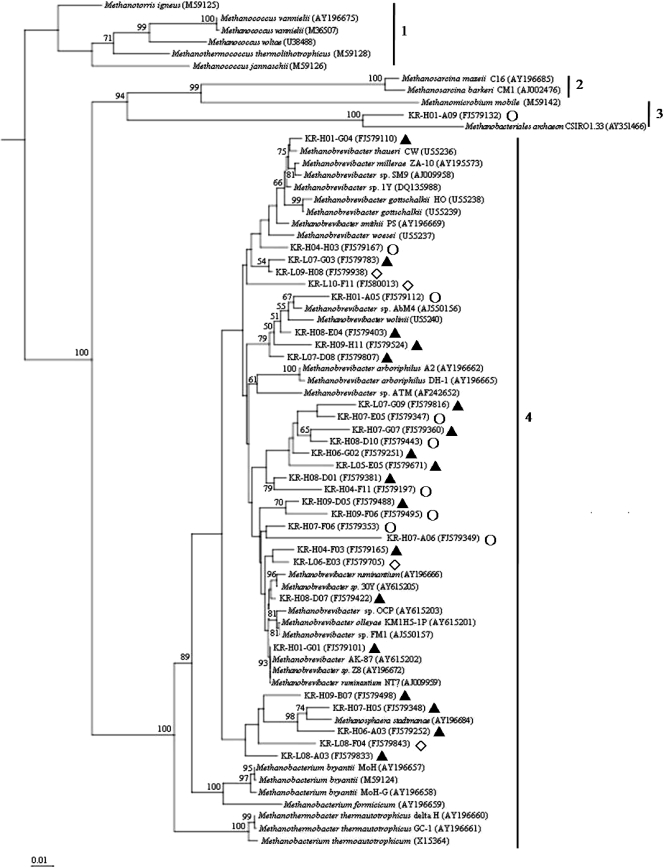
FIG. 4.
Phylogenetic analysis of methanogen partial 16S rRNA sequences obtained in this study. Representative sequences were generated by the Mothur program at a 3% difference level. GenBank sequences are identified by accession number. Bootstrap values (>50%) from 1,000 replications are indicated on the tree. 1, Methanococcales; 2, Methanosarcinales; 3, Methanomicrobiales; 4, Methanobacteriales; ▴, representative OTUs appearing in both libraries; ⋄, representative OTUs appearing only in library 1 (L-RFI animals); ○, representative OTUs appearing only in library 2 (H-RFI animals).

