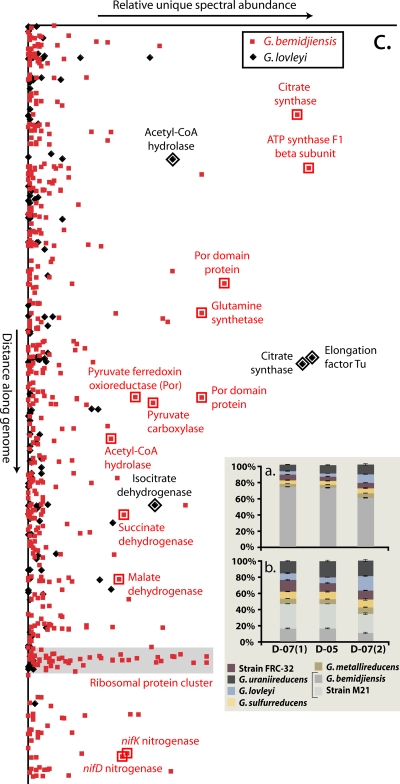
FIG. 3.
Counts of spectra unique to the Geobacter isolates as a percentage of the total number of unique spectra per sample. (a) Unique spectral count data observed when experimental results were searched using only the six Geobacter species with ∼60 to 70% amino acid identity (strain M21 excluded). (b) Spectral count patterns generated by a database search consisting of all seven Geobacter isolates (i.e., strain M21 is included). The percentage of spectra unique to G. bemidjiensis drops greatly when strain M21 is included due to the high amino acid sequence identity between G. bemidjiensis and strain M21. (c) Unique spectral counts for G. bemidjiensis and G. lovleyi in D07(2) plotted as a function of gene order. There are several loci where increased detection of unique spectra matching G. lovleyi indicates an environmental strain with similarity to both G. bemidjiensis and G. lovleyi.

