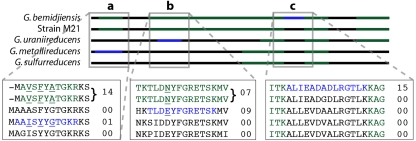
FIG. 4.
Identified peptide data from sample D07(1) mapped onto a schematic of aligned ribosomal S9 proteins. These data illustrate how inferences about strain makeup are achieved. Green regions indicate nonunique peptides, and blue regions indicate unique peptides. Expanded sections show the aligned amino acid sequence, with values displaying spectral counts for each peptide. Unique homologous G. metallireducens, G. uraniireducens, and G. bemidjiensis peptides and peptides unique to the G. bemidjiensis strain M21 group were present (regions a and b). The unique G. metallireducens peptide was identified much less frequently than the homologous G. bemidjiensis and strain M21 peptide (1 versus 14 spectral counts, respectively), suggesting the presence of a second protein variant at low abundance. Conversely, the unique G. bemidjiensis strain M21 and G. uraniireducens peptides have comparable spectral counts (seven versus nine spectral counts, respectively), consistent with two relatively equally abundant strain variants. The highest coverage is obtained using the G. bemidjiensis sequence due to the identification of a unique G. bemidjiensis peptide (section c). Given this and the high spectral count for this peptide, we infer that the dominant S9 ribosomal protein is from an organism more closely related to G. bemidjiensis than to other Geobacter isolates.

