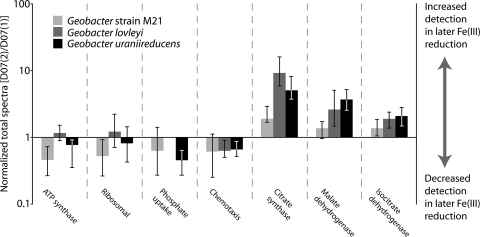
FIG. 5.
Changes in abundance of protein functional categories between early and late Fe(III) reduction samples, based on the ratio between NSAF values in D07(1) and D07(2). The patterns indicate a shift from a period of initial rapid growth to slower growth coupled with increasing energy demand later during biostimulation.

