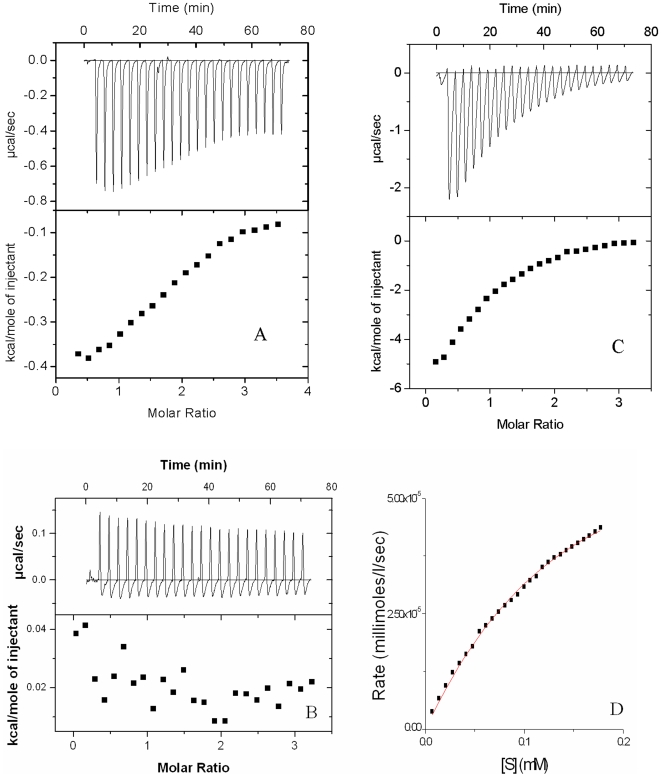
Figure 6. Phosphate donor specificity analysis.
Binding and kinetic reactions were carried out with alternate phosphate donors. A, B and C, Representative binding isotherms for 1 mM dATP, 1 mM GTP and 1 mM CTP binding to 1 mM DCoA-saturated 200 uM CoaE respectively. D, Kinetics with 1 mM dATP. In A, B and C, the lower plot shows the integrated area under the binding curve, per experimental point.

