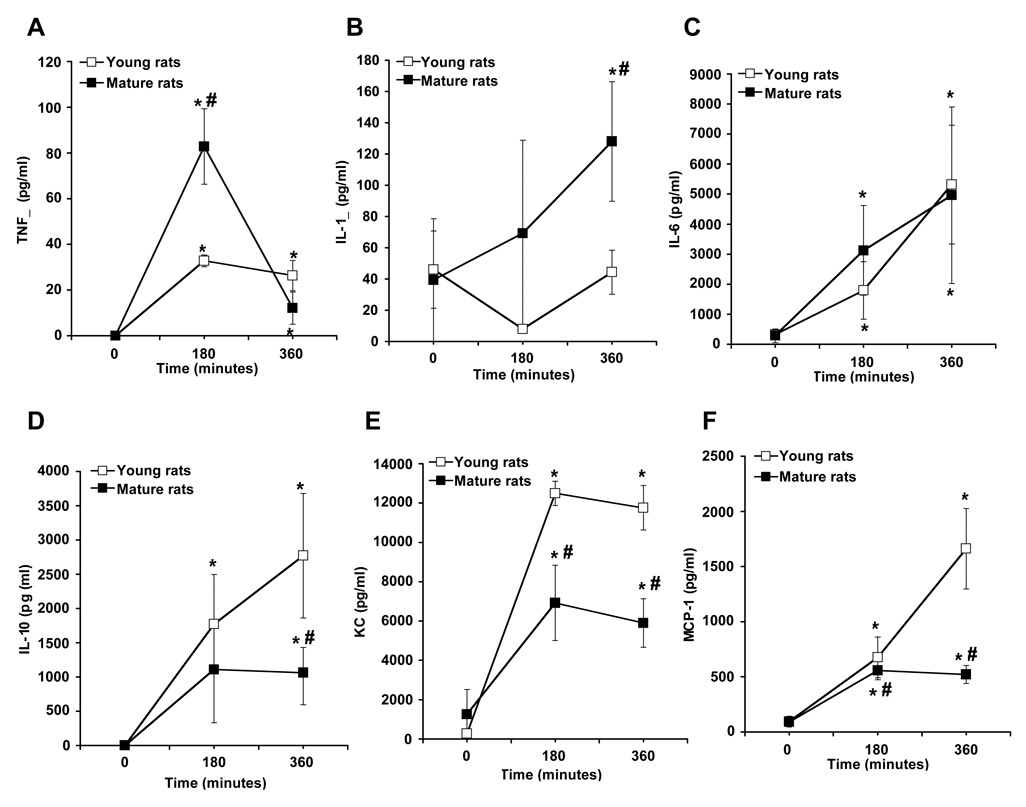
Figure 2.
Plasma levels of TNFα (A), IL-1β (B), IL-6 (C), IL-10 (D), KC (F) and MCP-1 (E) in young and mature rats. Each data point represents the mean ± SEM of 4–7 rats for each group at basal level (time 0), at the end of hemorrhage (180 min) and at the end of resuscitation (360 min). *Represents p <. 05 versus basal levels of same age group rats. #Represents p <.05 versus young rats at the same time point.

