
Fig. 1.
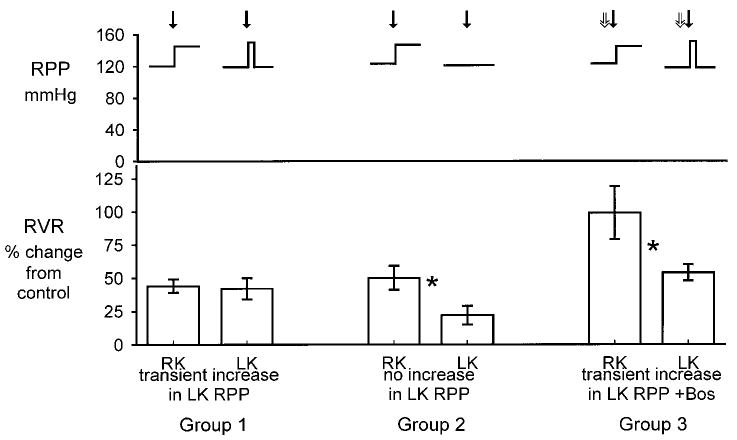
Top: change in mean renal perfusion pressure (RPP) to right kidney (RK) and left kidney (LK) in groups 1–3. Bottom: percentage change from control of renal vascular resistance (RVR) in RK and LK after systemic NO synthase (NOS) inhibition with l-NMA (solid arrows). Right kidney was always exposed to increased RPP, whereas measurements were made on the left kidney at control RPP. In groups 1 and 3, left kidney was transiently exposed to increased RPP (5 min), whereas in group 2 the left kidney was never exposed to increased RPP. In group 3, Bosentan (Bos) was given 5 min before l-NMA (open arrows). *Significant difference between right and left kidney, P < 0.05 by paired t-test.