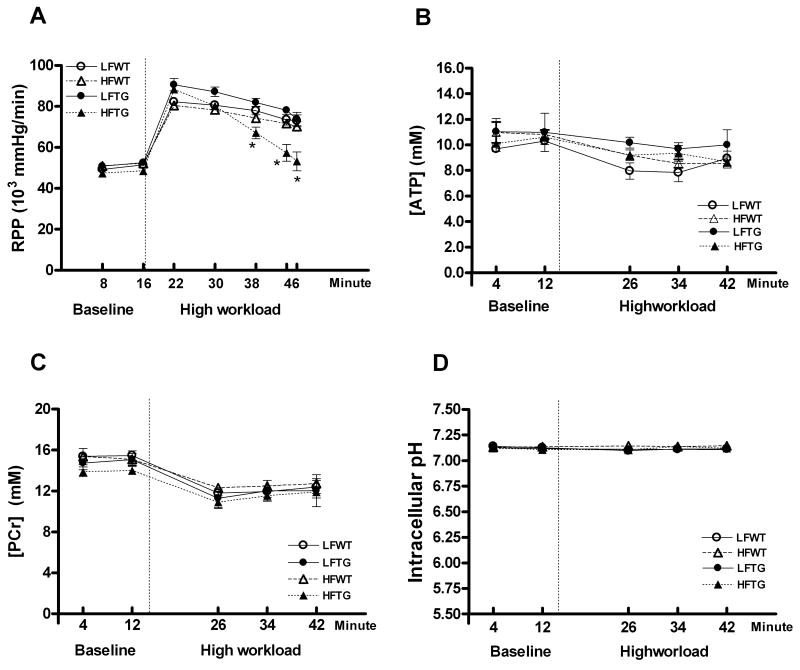
Figure 6.
Contractile function and myocardial high-energy phosphate of isolated perfused mouse hearts measured by 31P NMR spectroscopy. (A) Cardiac contractile function estimated as RPP (n= 6 to 12 per group). (B-D) Myocardial concentrations of PCr, ATP and intracellular pH (n=4 to 5 per group) in the hearts of WT and TG fed a HF or LF diet during baseline and high workload. Dotted vertical lines represent the switch from baseline to high workload. Data are mean ± SEM. *p < 0.05 vs LFWT.

