
Figure 2.
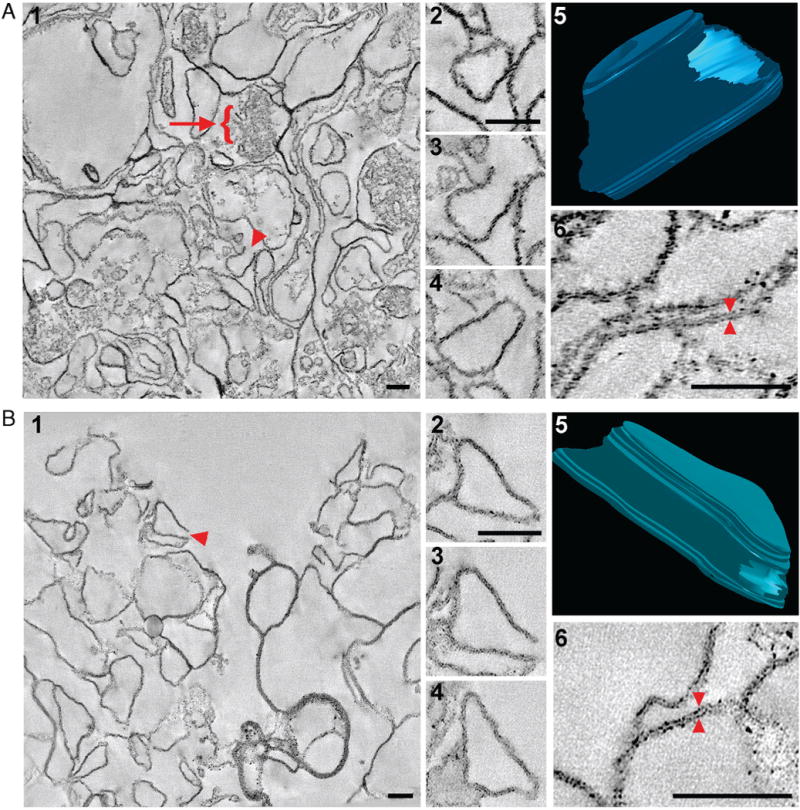
Three-dimensional structural analysis of isolated membranes using EM tomography. (A) Tomographic reconstruction of isolated membranes treated with high pH. A low-magnification overview of the reconstruction. Panel 1 shows that the sample consists primarily of membranes and protein aggregates (arrow). Many of the membrane components appear to be open with free edges (arrowhead). One such membrane structure (Panel 1, arrowhead) was modeled, and representative tomographic slices (7.6 nm thick) taken from different planes through its volume are shown in Panels 2 (closed), 3 (open), and 4 (closed). A 3D model (Panel 5), drawn from relevant slices of the tomogram, illustrates that the free edges are due to a large opening on one end of the membrane compartment. A higher magnification image confirms that lipid bilayers are intact (Panel 6). (B) Tomographic reconstruction of isolated “shaved” membranes. Membranes were agitated in high pH, then treated with 8 M urea and digested with proteinase K. The sample consists primarily of membranes without protein aggregates (Panel 1), and many of the membrane structures are open and have free edges (arrowhead). A selected membrane structure (Panel 1, arrowhead) was modeled, and representative slices are shown in Panels 2 (closed), 3 (open), and 4 (closed). The modeled reconstruction (Panel 5) again reveals that the free edges are due to an opening on one end of the membrane compartment. A higher magnification view of the tomographic slice confirms that lipid bilayers are intact (Panel 6). (Bars = 100 nm.)